| Issue |
A&A
Volume 608, December 2017
|
|
|---|---|---|
| Article Number | A121 | |
| Number of page(s) | 18 | |
| Section | Planets and planetary systems | |
| DOI | https://doi.org/10.1051/0004-6361/201628726 | |
| Published online | 13 December 2017 | |
Thermophysics of fractures on comet 67P/Churyumov-Gerasimenko
1 Max-Planck Institut fuer Sonnensystemforschung, Justus-von-Liebig-Weg, 3, 37077 Goettingen, Germany
e-mail: hoefner@mps.mpg.de
2 Institute for Geophysics and Extraterrestrial Physics, TU Braunschweig, 38106 Braunschweig, Germany
3 Department of Physics and Astronomy, Uppsala University, Box 516, 75120 Uppsala, Sweden
4 Jet Propulsion Laboratory, M/S 183-301, 4800 Oak Grove Drive, Pasadena, CA 91109, USA
5 Physikalisches Institut, Sidlerstrasse 5, University of Bern, 3012 Bern, Switzerland
6 Department of Physics and Astronomy “G. Galilei”, University of Padova, Vic. Osservatorio 3, 35122 Padova, Italy
7 Centro di Ateneo di Studi ed Attivitá Spaziali “Giuseppe Colombo” (CISAS), University of Padova, via Venezia 15, 35131 Padova, Italy
8 Department of Physics and Astronomy “G. Galilei”, University of Padova, Vic. Osservatorio 3, 35122 Padova, Italy
9 Aix-Marseille Université, CNRS, LAM (Laboratoire d’Astrophysique de Marseille) UMR 7326, 13388 Marseille, France
10 Centro de Astrobiologia (INTA-CSIC), European Space Agency (ESA), European Space Astronomy Centre (ESAC), PO Box 78, 28691 Villanueva de la Cañada, Madrid, Spain
11 International Space Science Institute, Hallerstrasse 6, 3012 Bern, Switzerland
12 Research and Scientific Support Department, European Space Agency, 2201 Noordwijk, The Netherlands
13 PAS Space Reserch Center, Bartycka 18A, 00716 Warszawa, Poland
14 Department for Astronomy, University of Maryland, College Park, MD 20742-2421, USA
15 Gauss Professor Akademie der Wissenschaften zu Göttingen, 37077 Göttingen, Germany
16 LESIA, Observatoire de Paris, CNRS, UPMC Univ. Paris 06, Univ. Paris-Diderot, 5 place J. Janssen, 92195 Meudon Principal Cedex, France
17 LATMOS, CNRS/UVSQ/IPSL, 11 boulevard d’Alembert, 78280 Guyancourt, France
18 INAF–Osservatorio Astronomico di Trieste, via Tiepolo 11, 34143 Trieste, Italy
19 Instituto de Astrofisica de Andalucia-CSIC, Glorieta de la Astronomia, 18008 Granada, Spain
20 Institute of Planetary Research, DLR, Rutherfordstrasse 2, 12489 Berlin, Germany
21 Institute for Space Science, National Central University, 32054 Chung-Li, Taiwan
22 Budapest University of Technology and Economics, Department of Mechatronics, Optics and Engineering Informatics, Muegyetem rkp 3, 1111 Budapest, Hungary
23 ESA/ESAC, PO Box 78, 28691 Villanueva de la Cañada, Spain
24 Department of Information Engineering, University of Padova, via Gradenigo 6/B, 35131 Padova, Italy
25 Observatory of the Hungarian Academy of Sciences, PO Box 67, 1525 Budapest, Hungary
Received: 15 April 2016
Accepted: 16 May 2017
Context. The camera OSIRIS on board Rosetta obtained high-resolution images of the nucleus of comet 67P/Churyumov-Gerasimenko (67P). Great parts of the nucleus surface are composed of fractured terrain.
Aims. Fracture formation, evolution, and their potential relationship to physical processes that drive activity are not yet fully understood. Observed temperatures and gas production rates can be explained or interpreted with the presence of fractures by applying appropriate modelling methods.
Methods. We followed a transient thermophysical model approach that includes radiative, conductive, and water-ice sublimation fluxes by considering a variety of heliocentric distances, illumination conditions, and thermophysical properties for a set of characteristic fracture geometries on the nucleus of 67P. We computed diurnal temperatures, heat fluxes, and outgassing behaviour in order to derive and distinguish the influence of the mentioned parameters on fractured terrain.
Results. Our analysis confirms that fractures, as already indicated by former studies about concavities, deviate from flat-terrain topographies with equivalent properties, mostly through the effect of self-heating. Compared to flat terrain, illuminated cometary fractures are generally warmer, with smaller diurnal temperature fluctuations. Maximum sublimation rates reach higher peaks, and dust mantle quenching effects on sublimation rates are weaker. Consequently, the rough structure of the fractured terrain leads to significantly higher inferred surface thermal inertia values than for flat areas with identical physical properties, which might explain the range of measured thermal inertia on 67P.
Conclusions. At 3.5 AU heliocentric distance, sublimation heat sinks in fractures converge to maximum values >50 W / m2 and trigger dust activity that can be related mainly to H2O. Fractures are likely to grow through the erosive interplay of alternating sublimation and thermal fatigue.
Key words: comets: general / comets: individual: 67P/Churyumov-Gerasimenko / radiation mechanisms: thermal
© ESO, 2017
1. Introduction
Since the arrival of ESA’s Rosetta mission at comet 67P/Churyumov-Gerasimenko (67P) in August 2014, a cometary nucleus is studied both in situ by a lander and by an orbiter for the first time. The first snapshot of a cometary nucleus was performed by ESA’s flyby mission Giotto to comet 1P/Halley in 1986, however: the Halley Multicolor Camera unveiled certain areas of the nucleus that appeared as sources of dust jets, while others appeared inactive (Keller et al. 1986). The mechanisms that lead to this dust jet activity have not been solved yet, despite both theoretical and experimental efforts, see for example Kührt & Keller (1994), Colangeli et al. (2004), Blum et al. (2014). Following cometary flyby missions like Deep Impact for comet 9P/Tempel 1, see for instance A’Hearn (2008), and ground-based observation with data reduction techniques, see Vincent et al. (2010), revealed jet morphologies and linked their source areas to confined surface features on the nucleus (Sekanina 2004; Farnham et al. 2013).
To study cometary activity, the relevant thermophysical processes of the nucleus need to be determined. This method was first applied to comets by Squires & Beard (1961). Comprehensive thermophysical models have been developed for this purpose, for example, Brin & Mendis (1979), Cowan & A’Hearn (1979), or Weissman & Kieffer (1981), and the so-called standard thermal model (STM) for comets (Prialnik et al. 2004) has evolved as the reference model. Several investigations based their models on the STM and derived diurnal temperature and heat flux profiles for the nucleus surface and its layers, for instance, Weissman & Kieffer (1984), Kömle & Dettleff (1991), Skorov et al. (2001), Rodionov et al. (2002), Davidsson & Skorov (2002), Capria (2002), Rosenberg & Prialnik (2010) and Klinger (1999). This enumeration is far from complete, and most of these models focus either on a global or generic description of the behaviour of cometary nuclei.
Thermophysical analyses through digital terrain models (DTMs) of a geometrically resolved cometary nucleus by Groussin et al. (2007) or Davidsson et al. (2013), for example, and generic irregularly shaped cometary nuclei (Gutiérrez et al. 2000) included effects of shadowing and the exchange of thermal infrared radiation, also known as self-heating. Correlations of synthetic temperature maps to measured nucleus surface temperatures derived by remote-sensing techniques revealed thermophysical properties of the cometary surface. The thermal inertia  (e.g., Prialnik et al. 2004) describes the time lag of surface temperature adjustments and depends on the densitiy ρ, the heat capacity c, and the heat conductivity λ of the upper layers of the nucleus. The analysis of nucleus surface emission spectra in the visible and infrared spectral range showed that a low thermal inertia such as I< 45 J m-2 K-1 s− 1 / 2 for comet 9P/Tempel 1 and I< 250 J m-2 K-1 s− 1 / 2 for 103P/Hartley 2 (Groussin et al. 2013) matched theoretical expectations. Nevertheless, Davidsson et al. (2013) obtained a wider range of possible thermal inertia values for 9P/Tempel 1 surfaces, depending on terrain properties.
In a detailed review about jets, Belton (2010) proposed that distinct physical mechanisms and topographic peculiarities might be responsible for dust jet activity. Kührt & Keller (1994) postulated the possibility of crack formation in the nucleus dust mantle, enhanced by high-temperature fluctuations and induced thermal stresses due to the low thermal inertia of the surface. Krebl & Kömle (2014) developed a 2D model for mass and heat transport in cracks and holes of the nucleus, and presented temporal evolution sequences for several diurnal periods. Direct Monte Carlo simulations (DMCS) of geologic jet formation indicated that narrow vent holes or pits are greatly favoured to create collimated outflows (Syal et al. 2013).
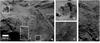 |
Fig. 1 Selected fractured areas on comet 67P/Churyumov-Gerasimenko, on Image NAC_2014-09-14T16.21.40.802Z_ID30_1397549001_F41. Panel a: Overview of the Ma’at regional morphology, according to El-Maarry et al. (2015a). Panel b: Fractures at the tops and sides of escarpments or cliffs. Panel c: Fracture networks. Panel d: Fractures on inclined terrain, grouped with similar-width orientation. See El-Maarry et al. (2015b) for the abundance and classification of fracture morphologies. |
 |
Fig. 2 Three different illumination conditions of the same fractured outcrop, the dominating fracture in the centre shows characteristics of a slingshot. |
The Optical, Spectroscopic, and Infrared Remote Imaging System (OSIRIS), which was the scientific camera system on board Rosetta (Keller et al. 2007), resolved morphologic features that fit the description of holes and vents: the surface of the nucleus is morphologically diverse, and one of the predominant surface features are fractures (El-Maarry et al. 2015b). Formation and evolution processes of these terrains are not yet well understood.
This paper focuses on the thermophysics of fractures observed on 67P. The aim is to determine how fracture geometry, solar illumination conditions, and thermophysical parameters affect diurnal sublimation patterns and induce erosive volatile and surfacial dust losses.
2. Methods
Geometrical properties of fractured terrains were derived from OSIRIS images, and DTM were derived from them (Preusker et al. 2015). We then used a theoretical approach to describe the governing heat fluxes, temperatures, and sublimation rates of typical model fractures. The nucleus properties were constrained by various instruments of Rosetta, including the MIcrowave spectrometer for the ROsetta spacecraft (MIRO), the Visible and InfraRed Thermal Imaging Spectrometer (VIRTIS), the Grain Impact Analyser and Dust Accumulator (GIADA), and the COmetary Secondary Ion Mass Spectrometer (COSIMA).
2.1. OSIRIS observations of fractured terrain
Our analysis used highly resolved images from Rosetta’s scientific camera system OSIRIS. The OSIRIS instrument consists of the wide-angle camera (WAC) with a field of view (FOV) of 11.9°, and the narrow-angle camera (NAC) for high-resolution images with a FOV of 2.18° (Keller et al. 2007). At a distance of 10 km to the nucleus, a NAC image has a resolution of ~15 cm. We used images taken between August 2014 and May 2015 on northern latitudes of comet 67P with an image resolution of between 10 cm and 50 cm.
The OSIRIS NAC observed heavily fractured terrains that are common in most areas on the surface of 67P (El-Maarry et al. 2015a), especially on gravitationally inclined slopes (Groussin et al. 2015), including cliffs (Pajola et al. 2016) and the walls of pits (Vincent et al. 2016). These landscapes on 67P consist of consolidated terrain, in contrast to apparently dusty areas (Thomas et al. 2015b). Characteristic morphological features that were identified especially on these consolidated terrains include fractures and partly furrows. Some areas are covered with blankets of mass-wasted material, apparently originating from low-velocity airfall (Thomas et al. 2015a), with fractured escarpments and bare outcrops in between. Cuestas and outcropping layered terrains, analysed in detail for the Philae landing site called Agilkia (La Forgia et al. 2015), are strewn with fractures.
Fractures come in a great topographic diversity; an overview and classification of their predominating appearance is given in El-Maarry et al. (2015b). The lengths of single resolved fractures range from a few to several hundred meters, and they tend to appear in groups. The distance between fractures on these terrain types varies, as do their intersection angles and distances. Some landscapes show nearly orthogonal fracture networks that appear to be mesh-like, while in other areas, the fractures form rather polygonal features. A mapping approach of various terrain geomorphologies (Fig. 5 in La Forgia et al. 2015) outlined that grouped fractures have a predominant stretching direction that varies from one specific location to another. Fractures are also observed on larger boulders (Pajola et al. 2015; El-Maarry et al. 2015a). The implied richness in fracture morphology is depicted in Fig. 1.
As the smallest detectable fracture sizes are constrained by OSIRIS image resolution, accurate estimates of the total area of fractured terrains are difficult. Images taken by CIVA on the lander Philae, however, revealed centimeter-sized fractures at the Agilkia landing site (Bibring et al. 2015).
Figure 2 depicts a variety of illumination conditions for a fractured outcrop in the Ma’at region (see description of regions in El-Maarry et al. 2015a). The fact that we can see shadows for various incident angles indicates an upper limit of the wall angles of the fractures of ≤30 degrees (see description in the next paragraph).
2.2. Parametric model of fracture geometries
We applied a parametric geometry approach to investigate the influence of illumination and emission characteristics.
Fracture dimensions are defined for its bottom (wb) and top (wt) width, h and l denote height and length of a fracture. The wall angle α describes the angular deviation of the fracture side walls to the bottom plane normal vector. The solar plane is defined by the cometary orbit around the Sun; hence the solar vector always lies in this plane. The fracture plane is set up by length and height of a model fracture. The plane angle η then expresses the angle between the solar plane and the fracture plane. The apex angle γ is defined to lie in the solar plane and describes under which angle the central area of fracture floor is directly illuminated by the passing solar vector. It is dependent on both plane and fracture wall angle, hence reflecting the direct illumination time of the fracture floor (see description in Fig. 3a). The fracture floor direct irradiation time per diurnal period then is tirr = Pdiuγ/ 2π. The bottom width of the analysed geometric models varies between 0.1 and 0.4 m, the fracture length and height are fixed to 5 and 1 m.
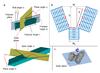 |
Fig. 3 Parametric model definition for a generic fracture: a) plane definitions, b) schematic nodal breakdown of a parametrised fracture with radiative heat exchange (red arrows) and effective conductive thermal fluxes (blue arrows), and c) solar plane with respect to the rotational axis of 67P at equinox. |
As these parameters already create several different cases and parameters to be investigated, we limited our analysis to situations where the solar plane (the entirety of all diurnal solar vectors) was perpendicular to the rotation axis of 67P (Fig. 3c). Strictly speaking, this assumption is only correct for the equinox. As our analysis focuses on the time of direct illlumination in fractured terrains (which is shorter than a diurnal rotation), and because of the irregular shape of comet 67P, this restriction is not expected to have a decisive effect on the results.
Model fracture parameter variations.
Table 1 shows an overview of all calculated and analysed geometry model variations in this investigation. The variation in plane angle η leads to a widespread range of apex angles γ for a single fracture geometry. We decided to analyse three different cases (detailed in Table 2). Fracture length and wall angle limit the maximum apex angle: because we assume a fracture length of 5 m in this analysis, the maximum apex angle is always lower than π. The minimum is defined by the bottom width wb and the wall angle α of the fracture geometry. A plane angle of η = 30° is considered a good compromise between the extreme values and is taken as the baseline for the geometrical model; but variations of the angle ranging from 0 to 60° are investigated and discussed as well.
Model fracture parameters: apex angles γ for variations of the plane angle η.
2.3. Nucleus properties of 67P
The rotation rate of 67P is subject to changes that are due to non-gravitational forces (Keller et al. 2015a). A diurnal rotation Pdiu of 12.4 h, with an obliquity of the rotational axis of 52 degrees was derived for the current perihelion approach of 67P (Mottola et al. 2014).
The estimated density of the nucleus of 67P was narrowed down to 535 ± 35 kg m-3 (Preusker et al. 2015). No global abundance of icy areas in at least the upper 50 μm of the surface could be detected (Gulkis et al. 2015). However, water ice is strewn in small localised patches mostly in shadowed areas below cliff structures (Filacchione et al. 2016; Pommerol et al. 2015), and water vapour forms the main constituent of the gas surrounding the cometary nucleus (Hässig et al. 2015).
Thermophysical properties can be derived from submillimeter and infrared emissions of the nucleus. MIRO measurements revealed a thermal inertia I of 15–30 J m-2 K-1 s− 1 / 2 (Schloerb et al. 2015) for 67P. VIRTIS spectrometer data distinguished between the thermal inertia of local terrain morphologies, as dust-layered areas exhibit values of 10–25 J m-2 K-1 s− 1 / 2, while the rougher consolidated terrain revealed I ≥ 50 J m-2 K-1 s− 1 / 2 (Leyrat et al. 2015). The thermal skin depth  with ω = 2π/Pdiu as a measure of the penetration depth of the thermal wave is then of the order of one centimeter.
Dust sample measurements by COSIMA (Schulz et al. 2015) and GIADA (Fulle et al. 2015) detected highly porous particles of sizes up to millimeter scales. Large grains observed by VIRTIS (Filacchione et al. 2016) have sizes of about 2 mm.
The average geometric albedo of the nucleus surface is 5.9 ± 0.2% (Sierks et al. 2015), and the emissivity is 0.97 (Spohn et al. 2015).
2.4. Thermophysical model of fractures on 67P
We developed and applied a thermophysical model based on a finite-difference computation scheme with volume elements that we refer to as nodes or cells. We used a transient model approach that enabled us to determine diurnal heat transport and temperature patterns, but neglects surface changes. The geometrical model fracture consists of flat quadrilateral elements, which are broken down into a finite number of rectangular cells. A high-resolution geometrical model is required to account for local illumination conditions and the complex shadowing patterns.
The geometrical mathematical model of a fracture is broken down to a mesh containing 24 000 volume elements and extends to a depth of 50 mm (see schematic nodal breakdown in Fig. 3b). The nodal dimension perpendicular to the surface (Δzi = 1 mm) is smaller than the side lengths of the volume element (~10–25 cm), which exceeds the diurnal skin depth length scale. Hence, we modelled heat transfer through the porous cometary layers with a simple 1D mesh, perpendicular to the considered fracture surface. A detailed discussion of whether this is a reasonable approach of sufficient accuracy is given in Davidsson & Rickman (2014).
Internal heat transport included radiative and conductive contributions, while gas diffusion and gas-solid interactions were neglected. Sublimation of volatiles was reduced to H2O only and treated through a heat sink term. Furthermore, we assumed that the radiative interaction of gases and particles in the coma surrounding the cometary nucleus are negligible for the thermodynamics of the surface layers.
The general thermal balance equation of a single node i then is  (1)Heat fluxes towards the considered node i are positive, and heat losses are negative. Qabs,i characterises the heat source term of absorbed solar irradiation at a node i, and Qrad,ij is the radiative heat flux between nodes i and j. Subscript j embraces all nodes in radiative contact with node i, including the deep-space boundary. Conductive heat fluxes Qcon,im and Qcon,in exist between the two neighbour nodes m (upper) and n (lower) perpendicular to the orientation of the respective fracture surface. Qsub,i denotes its heat sink that is due to sublimation processes, and Qcap,i is the capacitive heat storage.
The subsequent sections describe the particular contributions for Eq. (1).
2.4.1. Solar irradiation
Solar irradiation constitutes the single main source term of the heat balance of a cometary nucleus:  (2)Qabs,i denotes the absorbed solar heat flux of each considered surface element Ai, α the albedo, R the heliocentric distance of 67P in AU, and S the solar constant at 1 AU. The parameter θi describes the incidence angle between the surface normal and the solar vector and is time-dependent within a diurnal period Pdiu. Concave terrain morphologies face a major restriction compared to flat terrains: the exposure times at a certain surface element i are limited through shadowing of the fracture rims. Solar heat fluxes are therefore dependent on the exposure angle γexp of the surface element to the solar plane. The irradiation over a diurnal period Pdiu is determined by the fraction of the exposure time to a whole diurnal period γexp/ 2π = (t2−t1) /Pdiu. The total amount of absorbed impinging solar energy Eabs,i for surface element i then is
 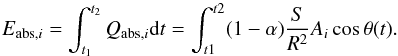 (3)The integration limits are set by the times t1 and t2 when the Sun passes both rims of the concavity, which differ for selected surface elements.
2.4.2. Radiative heat exchange
We assumed aggregate sizes that are larger than the visible and IR wavelengths, hence the Stefan-Boltzmann law is applicable to account for radiative heat transfer between fracture areas and towards space. The radiative heat flux, often referred to as self-heating, between two surface elements i and j is given by  (4)where εi and εj denote the IR emissivity of facets i and j, σ is the Stefan-Boltzmann constant, and T is the absolute temperature. Fij describes the view factor between surfaces i and j that are in radiative contact (Davidsson & Rickman 2014):
 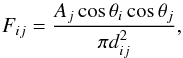 (5)which is valid in case of high emissivities (ε ≈ 1) and
  , with Aj being the area of facet j, θi and θj are the angles between the surface element normal and the connecting vector between both surfaces, and dij denotes the distance between the centres of facets i and j.
2.4.3. Sublimation
The predominant volatile species in 67P is H2O (Gulkis et al. 2015), consequently, we focused on the sublimation of water ice as governing heat sink. The temperature-dependent sublimation rate Z(T) was modelled using the classical Hertz-Knudsen approach and a sublimation coefficient αsub as described in Gundlach et al. (2011) and references therein:  (6)with psub being the sublimation pressure according to Clausius-Clapeyron, mH2O the mass of the sublimating water molecule, and k the Boltzmann constant. psub was approximated by
  (7)We used the coefficients a1 = 3.23 × 10¹² Pa and a2 = 6134.6 K as proposed by Gundlach et al. (2011). The sublimation enthalpy Hsub then defines the heat sink Qsub,i induced by the sublimation rate Z(T) of an area element Ai. As we only considered heat losses, this term is negative:
  (8)We restricted sublimation processes to take place in a small zone of <1.0 mm thickness, either close to the nucleus surface, or in a depth of some millimeters.
2.4.4. Heat transport mechanisms in the porous dust mantle
This study assumes that the surface layers of the cometary nucleus consist of a hierarchical structure of porous media, as indicated by findings of the COSIMA instrument on board Rosetta (Schulz et al. 2015). The transport of energy through these layers combines radiative and conductive heat fluxes; in case of volatiles, also the effects of gas diffusion and the transport of latent heat by phase changes, such as sublimation and deposition processes. Thus, all thermal processes within the porous cometary surface layers are merged to an effective heat conductivity λS,eff,  (9)with λCon being the purely conductive contribution, and λRad the radiative transfer between the particles. We neglected the contribution of diffusive gas processes λDif and the effect of phase changes λPhC in our model. This effective conductivity is controlled by a wide field of parameters, including the structural and geometrical composition of both the monomers and their aggregates, as well as material properties. The justification of this simplification is analysed in the discussion section.
The heat transport Qcon perpendicular to the surface AS of a structural layer in a comet is described by the Fourier law:  (10)Particular spherical grains, so-called monomers, coagulate to form an aggregate, and the aggregates then compound to the structure of the surface layers of the model cometary nucleus (Blum et al. 2014). Any modelling attempt therefore has to explicitly address the physical compositions that prevail in this compound. The approach to model the thermophysical behaviour of the upper layers of the comet nucleus is based on the idea of cohesive forces between particles. The Hertzian pressure then defines the contact and the subsequent conductivity, as detailed in Gundlach & Blum (2012) and references therein. Parameters that determine the effective layer conductivity are detailed in Table 3; the subscripts distinguish in ascending complexity between monomer (M), aggregate (A), and structural (S) level. The effective thermal conductivity λS,eff(T) then is (Eq. (14), Gundlach & Blum 2012, variables in Table 3)
  (11)with γA defined as (Eq. (15), Gundlach & Blum 2012, variables in Table 3)
  (12)and ξS a packing coefficient for the structural layer, approximated by ξS = 5.18 × 10⁻²exp(5.26 φS), with φS being the fill factor that describes the macro-porosity.
The effective thermal conductivity of a single agglomerate λA depends on the monomer properties (Eq. (16), Gundlach & Blum 2012, variables in Table 3):  (13)with the monomer surface energy γM = 6.67 × 10⁻⁵ J m-2 K-1 · T and ξA the aggregate packing coefficient for aggregates. The approximation ξA = 5.18 × 10⁻²exp(5.26 φA) differs from packing coefficient ξS in fill factor only.
The bulk conductivity is (Eq. (3), Gundlach & Blum 2012) that of vitreous SiO2:  (14)with b1 = (1.26 ± 0.05) × 10-3 W K-2 m-1 and b2 = (9.94 ± 0.20) × 10-1 W K-1 m-1 being fitted coefficients.
Model parameters of monomers, aggregates, and the nucleus surface layer structure for application in the effective thermal conductivity for porous dust layers composed of aggregates.
The radiative contribution λRad (Eq. (5), Gundlach & Blum 2012) is negligible on the monomer level, as the geometric dimensions imply λRad ≪ λCon. The radiative heat exchange between two separated aggregates assumes isothermal behaviour of the individual aggregate:  (15)with Λ(rA,φS) being the mean free path length for the averaged radiative heat transfer (Eq. (13), Gundlach & Blum 2012):
  (16)Comparisons between conductivity measurements of porous aggregates and the described theoretical approach (Gundlach & Blum 2012) resulted in a good matching.
2.4.5. Heat capacity of fractured terrain
The total surface area of the considered fracture geometries is up to 20 times higher than equivalent flat terrain. Thus, capacitive heat storage in the surface layers cannot be ignored. The heat storage of each node i is denoted as flux Qcap,i and dependent on its temperature Ti, heat capacity cS , and mass mS,i , which itself consists of monomer bulk density ρM and the two filling factors φC and φA of a single-volume element VS,i of the layer,  (17)The thermal inertia
  then is a temperature-dependent variable that relies on the cometary layer density ρS, the heat capacity cS , and the thermal conductivity λS,eff. The diurnal thermal skin depth (e.g. see the derivation by Kieffer et al. 1977)
 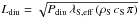 of a rotating surface element with diurnal period Pdiu = 12.4 h (Mottola et al. 2014) reveals the penetration depth of the thermal wave. The low thermal inertia of 67P results in a diurnal skin depth Ldiu< 0.05 m in all cases, which is smaller than any observed fracture size.
2.4.6. Energy balance in nucleus surface layers
When we apply Eq. (1), the thermal balance equation for each node is 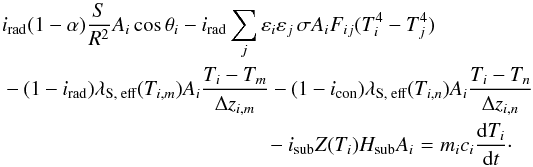 (18)The factor irad was set to 1 for all 480 surface nodes, and to 0 for interior nodes to account for the fact that only surface nodes exchange radiative fluxes with space and distant facets. The factor icon was set to 1 for all 480 boundary nodes at the interior end of the calculation space, otherwise it was defined to be 0. Factor isub was set to 1 at the sublimation front location, and to 0 for all non-subliming nodal positions. The subsurface layers are framed by 23 520 nodes, so every surface node relates to 49 interior nodes. The bottom boundary condition is adiabatic, that is, no heat flux is assumed to emerge or diffuse to deeper zones of the nucleus.
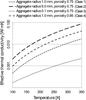 |
Fig. 4 Temperature-dependent effective thermal conductivities for thermophysical parameter cases 1–4: R denotes the radius of the agglomerates according to rA in Table 4, case 4 assumes a high porosity of 85% by lowering the fill factor of the agglomerate structure to 0.3. For comparison: lunar regolith is of the order of 0.001 W/mK. |
The heat transfer in the dust mantle was modelled with the described effective conductivity approach and applies to the two direct neighbouring nodes m and n only. The temperature-dependent effective heat conductivity λS,eff(Ti,(m;n)) was linearly interpolated for every node pair. Δzi,m and Δzi,n describe the spatial resolution between surface and interior node.
As the prerequisite for the aformentioned view factor (Eq. (5),  ) is violated, the radiative exchange was calculated numerically with a Monte Carlo ray-tracing algorithm. The view factor Fij was generated by detecting the amount of impinging rays on a facet j coming from facet i, and it includes multiple reflections. We assumed a Lambertian emissive behaviour of the surfaces. This ray-tracing method includes multiple reflections and scattering to third-party nodes. The solar irradiance term was calculated similarly through Monte Carlo ray-tracing.
The sublimation front was restricted to one node per 1D column. The outgassing mass-loss of an element of the sublimation front dmi/dt, and the element mass mi were decoupled and treated individually: dmi/dt has no effect on the nodal heat capacity Qcap,i. Our analysis varied the position of the sublimation front; standard cases restrict the sublimation front to fracture floor nodes and leave wall nodes to be inert.
We solved the non-stationary energy balance equations with a Crank-Nicholson solver and iteration method. We applied a commercial solver, ESATAN TMS1, which is a commonly used thermal analysis tool in space industry. The time step chosen for the analysis varied from 30 s for large solar distances to 1 s for 1.5 AU. Solar irradiation values were calculated for 90 positions of the Sun during day; this refers to a position every 2 degrees or every 4 min, respectively. Between these points, the illumination conditions were linearly interpolated. Diurnal cycles were repeated until the temperature difference between each revolution amounted to less than 0.01 K. The heat fluxes and temperatures were plotted in 60 s intervals; thus we obtained around 750 data points for every calculated property.
2.4.7. Variation of thermophysical parameters
In addition to the differences in fracture dimensions (Table 1) and illumination geometry (Table 2), the model variations comprise the following.
-
1.
Fracture geometry models A1–A8 were analysed for fiveheliocentric distances ranging between 1.25 and5.0 AU for a solar plane angle of 30°.
-
2.
Geometries A2 and A6, representative of a narrow and a wide fracture, were investigated for the impact of the effective thermal conductivity (Fig. 4). We varied the aggregate sizes and the aggregate fill factor (Table 4) for four cases.
-
3.
The influence of the volatile distribution in fractured terrain was studied by varying the sublimation front depth (0–5 mm) and its location: we analysed the effect of completely ice-free fractures on the one hand and fully icy fractures with sublimation from the fracture side walls and floor on the other hand. These investigations were restricted to geometries A2 and A6.
This purely theoretical approach to determining the conductivity fits the inferred thermal inertia measurements of 67P, which range between 15 and 120 J m-2 K-1 s− 1 / 2 (Schloerb et al. 2015; Spohn et al. 2015). The wide range, as depicted in Fig. 4, details that the effective thermal conductivity in all cases is dominated by the radiative contribution. We therefore assume that further variations of parameters that alter the conductivity produce similar results.
Thermophysical fracture model parameters for cases 1–4.
3. Results
We describe the computational results by analyzing the governing heat fluxes and temperatures of particular fracture geometries. Our aim is to derive the effect of the individual variables. We consider fracture geometry A4 at a heliocentric distance of 2 AU, a plane angle η of 30°, and a latitude of 0°, and thermophysical parameters according to case 1 as a baseline and reference for our analysis.
3.1. Differences between fractured and flat terrains
Governing heat fluxes and temperatures obtained for cometary fractures widely differ from those of flat terrains. We compared the fracture bottom area Ab = wbl (see Fig. 3) to flat areas with identical dimensions. Idealised flat terrains, neither shadowed nor characterised by surface roughness, show a sinusoidal insolation pattern during a diurnal period. Owing to the low thermal inertia, surface temperatures rise by about 2–3 K/min in the morning. This instantaneously induces IR surface emission, hence radiative and conductive fluxes to the interior. Assuming the sublimating ice front to lie within the first millimeter below the cometary surface, considerable sublimation rate values (more than 1 W / m2) are expected 30 min after sunrise. Sixty minutes later, they dominate emission and conductive fluxes. The peak sublimation rate accounts for 72% of the peak solar insolation; this value is attained three minutes after the subsolar point. The total sublimation enthalpy makes up 62% of the insolation for an entire diurnal period; the remainder is reemitted through thermal infrared radiation.
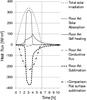 |
Fig. 5 Heat flux patterns for fracture A4 at a heliocentric distance of 2.0 AU and a plane angle η = 30° for one diurnal period of 12.4 h. The vertical lines at 0 h and 6.2 h indicate local morning and evening terminator. The coarse dotted grey line denotes the incident total solar irradiation, while the smaller black dotted line outlines the absorbed heat flux by the fracture floor. The grey continuous line shows the self-heating by infrared radiation, emitted from the fracture side walls, which impinges on the fracture floor: a positive value indicates a net heat flux direction towards the fracture floor. The grey dashed line illustrates the heat exchange with underlying nucleus layers through conductive and radiative transport. The black dashed line marks the local heat sink by sublimation phase change processes. For comparison, the dash-dotted line marks the sublimation pattern of a flat surface with identical thermophysical properties. The sublimation front is located directly at the surface of the fracture floor. Remarks: (1) the heat fluxes are related to 1 m2 sublimating fracture floor. Owing to the concave structure of geometry A4 and the decreasing width with depth, the fracture top sums up to 4 m2; (2) the fractured terrain absorbs about 4% more thermal energy than a flat surface because scattered irradiation is absorbed. |
Figure 5 outlines that while the solar irradiation is equivalent for both flat terrains and all fracture geometries (including fracture geometry A4, which was chosen as example here), especially the sublimation heat flux varies in temporal and absolute values. The solar plane angle of 30° results in a modest apex angle of 43.6° and hence a direct fracture floor illumination time of 90 min. Fracture A4 encompasses a surface of 22.3 times of that of a flat area, 95% of it are inert (non-subliming) fracture walls. These walls absorb incident solar irradiation and reemit infrared radiation, which is again partly absorbed by the fracture floor.
The sublimation pattern is almost exclusively created by direct solar illumination (which peaks at the subsolar point at 3.1 h) and self-heating (which shows an irregular pattern with its maximum when the floor passes into shadows). For fractures whose sublimation front is identical with the floor surface, conductive heat transfer is negligible. We note that while the heat capacity of the fracture floor is hardly perceptible in Fig. 5, the inert side walls store a considerable amount of energy: fracture walls have (1) no heat sink mechanism, but (2) cover 95% of the entire fracture surface.
The fracture side wall self-heating contribution peaks in 30% of the absorbed direct solar insolation in the local afternoon, and it adds a nighttime tail to the sublimation rate pattern. At the evening terminator, roughly 2 h after the end of direct insolation on the fracture floor, the sublimation heat sink adds up to 6.5% of its maximum reached 3 h before. Compared with flat terrains, sublimation becomes negligible (<1.0 W/m2) minutes before sunset. The time shift between the subsolar point and the peak irradiation accounts for 10 min, roughly three times longer than for flat terrain.
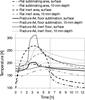 |
Fig. 6 Calculated diurnal temperatures for flat terrain and for the bottom of fracture geometry A4. The heliocentric distance is 2.0 AU, the plane angle is η = 30°, and the sublimation front is identical with the surface. The displayed fracture temperatures are averaged values over the four most central node positions at the fracture bottom, and 10 mm below it. |
The flat terrain temperatures vary between 100 K shortly before sunrise and 195 K at the subsolar point, with a surfacial thermal lag of 3 min (Fig. 6). While sublimation dominates the thermophysical processes, obtained surface temperatures remain on a quasi-flat plateau: around 190 K for more than 3.5 h. Temperatures at a depth of 10 mm (diurnal thermal skin depth) vary between 148 K and 175 K. If the flat terrain is completely inert, the absence of heat sink mechanisms results in higher floor temperatures between 120 and 270 K. Fracture geometry A4 shows a bandwidth of between 185 and 313 K when completely inert; the identical fracture geometry just with a sublimation front at the floor undergoes smaller diurnal temperature variations and ranks between 168 and 203 K at the fracture bottom, and 175–185 K at a depth of 10 mm below the sublimation front.
The pure ice-outgassing of a flat surface for a single diurnal period adds up to 1.0 kg m-2 erosion, which is in good agreement with findings of Colwell et al. (1990), who assumed slightly different parameters for albedo and diurnal period. The calculated fracture geometry A4 shows a similar amount of 0.94 kg m-2 of diurnal fracture floor erosion; maximum sublimation rates are 61% higher. However, one should take into account that fracture A4 takes up to four times more space than the considered flat facet because of the inclined walls.
3.2. Fracture geometry and illumination conditions
Depending on the fracture top width (wt, see Table 1), time-restricted direct illumination on the fracture floor drives the pattern of sublimation. The smallest fracture geometries lose volatiles even during the entire shadowed period; their sublimation enthalpy flux never drops below 9.0 W/m2.
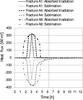 |
Fig. 7 Diurnal absorbed solar irradiation and sublimation fluxes for fractures A1, A4, and A8. The fracture floor sublimation front is located directly at the surface node. The vertical line at 6.2 h denotes the evening terminator. |
The integrated sublimation heat flux over one diurnal period monotonically increases with wt (Fig. 7). We note a similar trend of stronger diurnal temperature fluctuations for broader fractures. The peak sublimation rate is the global extremum of the sublimation heat sink curve, and all analysed fracture geometries show an increase of this property when compared to flat terrain, with factors between 1.28 and 1.68 (Fig. 8). Fracture geometries A1–A8 reveal their highest peak sublimation rates at wall angles between 15 and 20°. Wider fracture geometry setups (e.g. geometries with a higher wb/h ratio, such as B or C in Table 1) outline a less strongly pronounced peak.
Assuming a dust-to-ice ratio of 4 as measured for 67P by Rotundi et al. (2015), the obtained sublimated mass loss and the resulting retreat of the dust-ice mixture that forms the fracture bottom grows concurrently to apex angle and insolation time (Fig. 7). At a heliocentric distance of 2.0 AU, the total diurnal erosive mass loss accumulates to 3−13 mm.
Our analysis makes use of a solar plane angle of 30° and results in apex angles of between 11 and 90° (see Table 1). To account for the fact that the fractures on 67P do not have a certain preferred global direction, we calculated fracture illumination patterns with solar plane angle variations of 0 and 60° (Table 2) to cover a wide range of insolation conditions. One of the main results is that peak sublimation rates, significantly dependent on the fracture geometry, are less strongly affected from the solar plane angle.
Figure 9 analyses the total energy that is consumed for sublimation diurnally, normalised on the fracture top width wt. Increasing wall angles lead to a decline of the normalised total sublimation enthalpy; this effect is most pronounced for low plane angles. When we compare these results to a partly sublimating flat surface with ratio wb/wt as depicted in Table 1, fractures with less steep walls result in higher relative diurnal sublimation values.
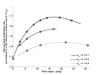 |
Fig. 8 Normalised peak sublimation rate as a function of fracture wall angle, analysed for 16 fracture geometries. The diurnal peak sublimation rate is normalised to that of a flat surface with identical illumination and thermo-physical properties, and the same area as the fracture bottom. The circles denote calculated values, the lines show interpolating cubic functions. The dashed line depicts fracture geometries A1–A8 with a bottom width-to-height ratio of 0.1, the dash-dotted line B1–B4 and the dotted line C1–C4. All calculations were performed for 2.0 AU heliocentric distance, a plane angle of 30°, and a surfacial sublimation front. |
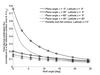 |
Fig. 9 Normalised total diurnal sublimation energy, integrated over one diurnal period, displayed as a function of the fracture wall angle and analysed for four illumination scenarios. The sublimation energy is normalised to the total irradiated energy in all areas of the fracture. The circles denote calculated values, the lines show the trend employing cubic interpolation functions. All calculations were performed for 2.0 AU heliocentric distance and surface ice at the fracture floor only. The grey line indicates the total sublimation energy for a flat surface, if we assume that parts of the surface are inert: the sublimating area of the flat terrain equals the ratio between bottom and top width wb/wt. |
Generally, our analysis shows that the diurnal sublimated enthalpy of fractures with a large top width wt that result in large apex angles and therefore long illumination times do not significantly rely on the illumination geometry; for wall angles of 15° and larger, the factor is two or smaller. Fractures at higher latitudes (the model calculation took one case with a latitude of 30°) show lower relative sublimation rates. The reduction factor of roughly 0.8 is smaller than the cosine law predicts, therefore the dependency on the latitude is stronger than expected.
3.3. Location of ice
The distribution of ices in the model fractures influences the sublimation rate and its diurnal partition. We varied the position of the water-ice sublimation front between 1 and 5 mm depth from the surface, and considered inert (i.e. no sublimation term) and icy (sublimating) fracture walls; the latter being named “fully icy”.
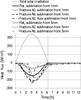 |
Fig. 10 Diurnal irradiation and sublimation fluxes for fully subliming fractures A2 and A6. The grey dotted line shows the solar irradiation for one diurnal revolution at 2 AU as a positive heat source, the sublimation heat sinks are depicted for two sublimation fronts of 1 mm and 5 mm depth. The vertical line at 6.2 h denotes the terminator. |
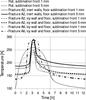 |
Fig. 11 Calculated diurnal surface temperatures for flat terrain terrain (dashed) and for fracture floor geometry A4 (inert: continuous; icy floor: dotted). The sublimation front is located at a depth of 1 mm (grey) and 5 mm (black). The heliocentric distance is 2.0 AU, the plane angle is η = 30°, and the sublimation front is identical to the surfacial node. Fracture temperatures are averaged over the four most central node positions at the fracture bottom. |
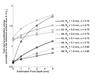 |
Fig. 12 Normalised total diurnal sublimation energy as a function of the sublimation front depth. The sublimation front in the fracture floor is analysed for four different surface layer material properties (aggregate radius rA and porosity Φ) and hence effective thermal conductivities (see Fig. 4). The sublimation energy is normalised to that of a flat surface with identical properties and the same area as the fracture bottom floor. The circles and rectangles denote calculated values, with the lines being cubic interpolated data. All calculations were performed for 2.0 AU heliocentric distance, a solar plane angle of 30°, and two fracture geometries: A2 and A6. |
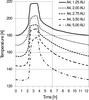 |
Fig. 13 Fracture A4 floor temperatures for five heliocentric distance settings with surfacial sublimation. The vertical line at 6.2 h denotes the terminator. |
The diurnal sublimation pattern of a fully icy fracture is stretched and appears more bulgy during daylight than a fracture with an active floor alone (Fig. 10). This is no surprise, as the time spans for which side walls receive direct insolation are also extended. The diurnal sublimation rate of flat terrain constantly lies below the fully icy fracture, and the difference tends to increase with the retreat of the sublimation front. Peak sublimation rates of fully icy fracture with a 5 mm deep sublimation front show a time shift of 35 min for the narrow fracture geometry A2; the wider geometry A6 reaches its maximum 40–70 min later. This peak sublimation rate differs by less than 10% when we compare fully icy and partly inert fractures.
The total sublimating flux obtained from a fully icy fracture accounts for 144% of its respective flat area in case of a sublimation front at a depth of 1 mm. When we consider a depth of 5 mm, an individual fully icy fracture releases up to 230% more volatiles than flat terrain with equivalent sublimation front depth. The highest peak sublimation rates in the fully icy cases were detected at the fracture bottom during direct perpendicular illumination conditions. When we consider total diurnal properties, fracture wall sublimation dominates, simply because the fracture walls outnumber bottom areas by a factor of more than 20. We note that owing to shadowing and obscuration, certain areas of the fracture walls achieve significantly higher sublimation rates than others, however.
We confirm that the sublimation front retreats to deeper nucleus layers and results in higher surface temperatures (Kührt & Keller 1994; Fig. 11). Fracture floors with steep (geometry A2) or more gently inclined (A6) fracture walls both result in higher temperatures than their flat equivalents. We note that the general temperature level for fully icy fractures constantly results in 10–40 K lower temperatures than their counterparts with inert walls. Icy walls, in contrast to inert non-icy walls, do not store thermal energy, and instead tend to release their volatiles. This results in generally stronger sublimation rates but also lower self-heating fluxes towards the fracture floor, and it further explains the lower sublimation rates during night times.
3.4. Influence of thermal conductivity
We investigated four different effective thermal conductivities λS,eff created by variations in macro-porosity φS and aggregate radius rA (Table 4). The total sublimation energy, accumulated over one diurnal cycle (see Fig. 12) and normalised to flat terrain, shows a clear trend for geometries A2 and A6: the deeper the sublimation front is located within the layers of aggregates, the stronger the relative sublimation rate. This relationship is more pronounced for cases with low conductivity in combination with steep fracture side walls.
The lower conductivity of the porous dust mantle increases the maximum temperatures of the fracture wall, hence the thermal infrared flux to the fracture bottom is increased with a shorter thermal lag than in higher conductivity cases. A lower thermal inertia of the walls can therefore enhance the peak sublimation rate, as the self-heating flux is consumed almost entirely in sublimation.
The high-conductivity model results in a relatively fast transport of energy to deeper layers. The porous media heat transport dominates the sublimation heat sink as long as the temperature gradient in the fracture bottom is large. After the bottom of the ice layer is reached by the thermal wave, more and more energy is consumed for sublimation. The thermal lag between illumination and the onset of considerable sublimation is higher than in standard conductivity cases. Sublimation is considerably supported by the heat capacity of the ice layer, hence it decreases slower after sunset. We also note an increase in average temperatures in the fracture bottom. An ice layer with high thermal inertia lowers the differences that are due to fracture geometry.
3.5. Diurnal patterns for heliocentric distance variations
The diurnal temperatures calculated for heliocentric distances between 1.25 and 5.0 AU have similar patterns: the bandwidth accounts for values between 30−50 K, fracture floor temperatures rise steeply during direct illumination, and eventually reach a quasi-flat plateau (Fig. 13). This plateau is additionally shaped by the sublimation heat sink and the self-heating contribution of the fracture wall: considerable sublimation rates are triggered at 180 K. The amount of solar energy used for sublimation processes rises when approaching the Sun. Self-heating from the surrounding fracture walls does not significantly (by less than 10%) add up to the energy budget of the fracture floor beyond 2 AU. At 5 AU heliocentric distance, diurnal net infrared emission emanating from the fracture bottom is stronger than the sublimation enthalpy by a factor of 4.8.
This difference in the composition of thermal fluxes contributes to steeper plateaus in the temperature diagrams for 5.0 and 2.0 AU. The influence of self-heating increases to 45% of the solar irradiation for fracture geometry A6 at 1.25 AU. The effective conduction to lower layers has a negligible contribution (<3%) to the overall heat balance. Conversely, at higher heliocentric distances, the fluxes through porous media make up one-third of the thermal balance.
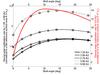 |
Fig. 14 Peak sublimation rate as a function of fracture wall angle for five heliocentric distance settings, normalised to an identical flat surface. The circles and rectangles denote calculated values, and the lines show cubic interpolation functions. All calculations were performed for a solar plane angle of 30° and surface sublimation at the fracture bottom. |
Our analysis extends the results of similar heat trap geometries (craters of different geometries and heliocentric distances in Colwell et al. 1990, their Fig. 5) from steady-state to transient calculations. The cumulative effect of concave, fractured terrain features on normalised sublimation rates gains strength at larger heliocentric distances (Fig. 14) with factors of between 1.6 for 1.25 AU and 14 at 5.0 AU. For 5.0 AU (typical aphelion distances of Jupiter-family comets; 67P spends 2.5 yr per orbital revolution at distances >5.0 AU), the peak sublimation rate maximum is 4.7 × 10⁻⁶ kg m-2 s-1. For a distance of 1.25 AU (close to perihelion at 1.243 AU), we obtained a maximum of 4.1 × 10⁻² kg m-2 s-1, equivalent to an erosion of 4 mm pure compact ice per diurnal period. Assuming a dust-to-ice ratio of 4 as measured by Rotundi et al. (2015) and a thermophysical model porosity of 0.75, the diurnal erosion adds up to 6.4 mm. An interpolation of the peak sublimation rates yields that the fracture wall angle favouring the strongest sublimation rates shifts from 10° at 5.0 AU to 18° near perihelion of 67P.
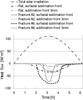 |
Fig. 15 Diurnal sublimation rates for a sublimation front at the surface and at a depth of 3 mm calculated for a heliocentric distance of 3.5 AU. The solar irradiation pattern for a flat surface is shown in comparison (boldface, dashed line); values are restricted to the 6.2 h in direct illumination conditions. Fractures A2 (dotted line) and A6 (dashed line) have sublimating floors. All calculations were performed for a solar plane angle of 30° and sublimation originating only from the fracture bottom. |
The energy balance for a heliocentric distance of 3.5 AU indicates that flat terrains with surface ice achieves peak sublimation rates of 34 Wm-2, respectively 1.2 × 10⁻⁵ kg m-2 s-1. This value drops to 4.0 × 10⁻⁶ kg m-2 s-1 for a sublimation front depth of 3 mm.
Fracture sublimation rates peak at 2.9 × 10⁻⁵ kg m-2 s-1, this equals a heat sink of 81 W m-2, and they remain for about two hours at values higher than 50 W m-2 for fracture geometry A6, while A2 still reaches 72 W m-2(2.55 × 10⁻⁵ kg m-2 s-1). This value is significantly lower than the maximum solar irradiation of 110 W m-2, but enhanced by a factor 2.4 compared to flat terrain sublimation numbers (Fig. 15). Fractured and flat areas both outline significant sublimation rates after 1.5 to 3 h of direct illumination alone. This effect is not caused by the low thermal inertia of the material, but is due to the surface inclination: beyond an inclination angle of 45° inbound and 60° outbound, the sublimation accounts for less than 3 W m-2.
3.6. Temperature gradients and temporal evolution
Our analysis compares temperature changes of several inert fractures with no sublimation front (Fig. 16) to unshadowed flat terrains. Flat terrain exhibits the strongest fluctuations at high incidence angles near both terminators. Fractured terrains reach highest values when the Sun illuminates the bottom, and temporal variations are due to shadowing of the fracture walls. As wider fractures occur together with wider temperature bandwidths, their peak of the temperature change is higher than for their small counterparts. We obtain heating rates of 4.2 K/min for fracture A6 at 2.0 AU heliocentric distance; the cooling rates are significantly lower (2.5 K/min). The mentioned high values only last for 20 min; the flat terrain appears more balanced. Even at a depth of 10 mm in the dust mantle of the fractured terrain, temperature changes of up to 1 K/min exist, which is about twice that of the flat terrain.
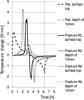 |
Fig. 16 Diurnal temperature changes for fractures A2, A6, and a flat surface. The fracture is fully inert without any sublimation. The vertical line at 6.2 h denotes the terminator. |
Highest temperature gradients in the surface layers were obtained for simulations with a sublimation front depth of 1 mm: fracture floor temperatures within the dust mantle attained 50 K/mm, slightly higher than the retrieved 35 K/mm for flat terrain. The surface temperature of Fig. 11 reaches 250 K for fracture A2, while the underlying sublimation temperature is below 200 K. The effective thermal conductivity bridges values between 0.0034 and 0.0065 W/mK, indicating that the temperature gradients on smaller scales might be higher.
4. Discussion
4.1. Heat trap mechanism of cometary fractures
The effect of morphological features on surface temperatures of atmosphereless planetary bodies covered with low thermal inertia regolith has previously been investigated for the case of lunar craters during eclipse (Saari & Shorthill 1963). The study of concave topographies on comets that retain heat due to comparably low thermal emission towards deep space, and as such increase surface temperatures or enhance local sublimation rates of volatiles, gained attention in the aftermath of the Giotto mission to 1P/Halley. Theoretical sublimation rates of ices in trenches and spherical concave structures depend on the geometrical setup; the erosion rate of crater floors is stronger than flat or inclined terrains and accounts for growing crater floor depths and wall steepening (Colwell et al. 1990). A comparable approach (Ivanova & Shulman 2002) postulated inert dusty cone walls and volatile-rich sublimating floors and indicates amplification of local sublimation and elevated temperature levels compared to flat areas.
The investigated model fractures in this analysis, despite variations in illumination patterns, fracture geometries, and different thermophysical parameters, generally revealed smaller temperature variations, higher average temperatures, and higher peak sublimation rates than flat terrains of similar composition. Their ability to emit thermal radiation, mathematically expressed with a geometrical view factor Fij towards deep space, is reduced to only small solid angles. The view factor towards other fracture components is larger, in some narrow model fractures even more than an order of magnitude. The solid angle towards space is smallest for fractures with vertical walls, which outline the lowest cooling rates of all performed analysis. Conversely, a shallow fracture possesses larger Fij, leading to stronger emissive terms Qrad, hence faster temperature decrease; flat terrain consequently generates the highest cooling rates.
The expected heat trap mechanism for concavities on planetary bodies (Lagerros 1998) is confirmed in our analysis for cometary nuclei: solar irradiation impinging on the bottom of the fracture leads to a fast increase in temperatures and sublimation rates. A larger portion of the insolated energy is consumed for volatile sublimation instead of reemission. In all calculated cases, maximum outgassing rates in even short-time illuminated model fractures are stronger than on flat terrain. Our findings can also be transferred to fractures with analog geometrical size ratios, as long as the overall dimensions of the fracture are larger than the diurnal skin depth. We note, however, that other concave topographies detected on 67P can show similar effects as presented here for fractured terrain.
4.2. Thermal model considerations
To which extent does the modelling reproduce observational reality, and are we able to determine this? Determined by Rosetta’s orbital parameters, the OSIRIS camera remote-sensing imaging possibilites are restricted by resolution and phase angle. The observational constraints still allow for great freedom in varying and fitting the parameters for thermophysical model complexity. As a consequence, there cannot be one single “proper” way of fracture modelling that tries to describe and resolve the governing thermophysical processes, especially as OSIRIS and ROLIS images proved morphologic heterogeneity on several scales, for example Thomas et al. (2015b), Mottola et al. (2015), Bibring et al. (2015).
In our analysis, we varied illumination and fracture geometries as well as parameters of the surface structure, which led to about 120 evaluated fracture models and resulting datasets. Some results are very robust to parameter variations, for example, the prevailing heat trap mechanism of fractures, while other findings are not dependent on a single variable alone. Hence, it is hardly possible to adjust complex thermal models with a wide variety of input parameters to observational facts. In our conclusions, we therefore emphasise the specific effect of the currently parametrised and investigated variable on the computational findings.
4.2.1. Diffusion and phase-change effects in porous media
The porous media heat transfer model in this analysis neglected the effect of both consecutive phase changes and diffusive gas on the effective thermal conductivity. We argue that these effects enhance thermal fluxes only locally.
Experiments with granular material (Huetter et al. 2008) resulted in no detectable influence of the gaseous phase on conductivities for ambient pressure levels up to the water vapour saturation pressure at 200 K. This value is met for heliocentric distances >2.0 AU. Diffusive transport of latent heat by successive phase changes played a dominant role in the KOSI experiments in thin layers near the sublimation front (Benkhoff & Spohn 1991). Sublimation and subsequent deposition is an extremely effective heat transport mechanism, as the latent heat of water ice is several orders of magnitude higher than its specific heat for small temperature ranges. The length scales are estimated from the gas molecule mean free path length in the Knudsen regime of the porous surface layers, which is defined rather by the macro-porosity φS and the aggregate radius rA (Skorov et al. 2011). Assuming rA of 1 mm, the zone of sublimation and deposition has a bandwidth of about several mm, and it locally enhances the effective thermal conductivity.
This leads to enhanced inbound heat fluxes through porous layers during direct illumination times, and a rising thermal inertia of the layer. The energy conservation can shift or extend the sublimation period or increase surface temperatures to shadow phases. During this shadow-cooling phase, which is significantly longer for fractured than for flat terrains, temperature profiles reverse. Recondensation generally takes place in fracture parts that are colder than the sublimation front, for example, because of frost layers closer to the surface (De Sanctis et al. 2015). The mechanism applies to all volatile species in the cometary nucleus, thus several of these zones should exist at several depths of the nucleus, governed by diurnal and orbital skin depths. The effect of sublimation and deposition has been studied for cometary ice cracks by Kömle & Dettleff (1991) and has been considered to be relevant only when the mean free path is large. We note, however, that their analysis employed a thermal bulk conductivity of ices that is two orders of magnitude larger than our model with smaller porous conductivities.
4.2.2. Porous aggregate textures and effective thermal conductivity
The alternating sublimation and deposition phases in the cometary layers lead to a pore size decrease and the formation of a dense sintered layer (Grün et al. 1993). The reduced permeability of these layers limit diffusive phase change heat transport methods to short distances, and as a consequence, restructure layer textures. As discussed in the section about porous dust mantle formation, this complex effect changes the aggregate size distribution and its macro-porosity, and results in affecting thermal conductivity. The effective thermal conductivity approach of our analysis is dominated by radiative transfer between non-sintered aggregate layers (Gundlach & Blum 2012). Aggregate sizes (Rotundi et al. 2015) could be in the range of the typical sublimation front depth scales of the nucleus, which is why we used model radii between 0.1 and 1 mm. The extremely low contribution of solid conduction of the porous structure is based on the theory of small cohesive forces between aggregates of these sizes.
The idea of including radiative heat transfer to obtain an effective thermal conductivity of porous layers requires that (1) the temperature gradients for scale lengths are about the size of the mean free path between aggregates; and that (2) single aggregates are isothermal. Neither of these prerequisites is entirely guaranteed in our analysis (especially for the large aggregate size), and they do not account for additional heterogeneities of a real nucleus surface. We conclude that especially the temperature-dependence of the effective thermal conductivity is subject to wide uncertainties. Thermal inertia estimates flanked with derivations of heat capacity and density can at least help to constrain the order of magnitude of conductive heat transfer, however.
4.2.3. Erosive losses
Another mechanisms that influences the temperature profile in the surface layer is erosion. Sublimation and the potential entrainment of dust particles reshape the nucleus surface and expose previously covered layers. This approach is often denoted as a Stefan problem and applies moving boundaries on the nodal entities. We tested the influence of erosion for our model and found significantly reduced temperatures in deeper layers and moderately decreased obtained sublimation rates. Model complexity and run-time were widely increased, but the ratio of sublimation rates between fractured and flat terrain did not deviate much. We therefore decided to apply the simpler approach and neglected erosion effects in our analysis.
Nevertheless, we wish to point out some implications on the erosive behaviour of fractured terrains in Sect. 4.5.
4.3. Thermal inertia of fractured terrains
Thermal inertia measurements of the surface of 67P, obtained through remote-sensing methods, range from 15 J m-2 K-1 s− 1 / 2 (Lowry et al. 2012; Schloerb et al. 2015) to 120 J m-2 K-1 s− 1 / 2 (Spohn et al. 2015). However, the effect of surface roughness on the determination of thermal inertia (Davidsson et al. 2015) might lead to misinterpretations of terrain topography or its thermophysical properties.
4.3.1. Thermal infrared emissions
The computationally investigated differences between fractured and flat terain can be revealed by remote-sensing methods. The hemispherical brightness temperature is defined as the integrated surface emissive flux equivalent for one specific fracture; this heat flux is expressed as a temperature according to the Stephan-Boltzmann law. A distant observer, who is not capable to resolve the fracture geometry itself, hence receives a thermal pattern that is equivalent to the brightness temperature. We point out, however, that the real received brightness temperature is also dependent of the position of the observer (Davidsson et al. 2015), which is neglected in this analysis.
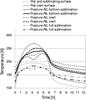 |
Fig. 17 Diurnal hemispherical brightness temperatures of flat and fracture geometries A2 and A6 for different sublimation patterns. The heliocentric distance is 2.0 AU, the plane angle is η = 30°, and the sublimation front is identical to the surfacial node. The dotted line shows the brightness temperature for flat terrains (sublimating and inert), while fracture geometries A2 (grey) and A6 (black) in three different configurations are displayed: for completely inert (dashed), sublimation of both bottom and walls (dash-dotted), and pure fracture floor/bottom sublimation. |
4.3.2. Brightness temperature patterns
The brightness temperature patterns generally follow the sinusoidal diurnal irradiation, as depicted in Fig. 17. A flat surface of low thermal inertia (31 J m-2 K-1 s− 1 / 2) results in a time shift of a few minutes between maximum irradiation at the subsolar point and the temperature peak: the maximum value, measured in the deviation of the local hour, lags 1° for a sublimating and 6° for an inert surface. The lag for inert fractures is longer, and the time shift accumulates for shallower fractures: fracture A2 with a wall angle αA2 = 14.0° accounts for 20.3 degrees, A6 with αA6 = 2.9° accounts for a lag of even 45.5 degrees after peak irradiation. Fractures with a sublimation front in the floor outline a more complex behaviour with two brightness temperature peaks, of which the global maximum lies in the afternoon during one diurnal rotation. Night-time brightness temperatures of fractures are generally higher than for flat terrain, while the heating and cooling rates are both lower.
We used our synthetic brightness temperatures from fractured terrains as a substitute for measurements by distant observers (Fig. 17) and compared the diurnal process to the temperature calculated solely for the floor of a fracture (Fig. 11). The comparison shows that (1) high bottom temperatures are hidden to a potential observer; and (2) the fracture tends to react inertially to the interplay of incoming insolation: the heating and cooling rates as well as the temperature bandwidth indicate a higher “apparent” thermal inertia that is due to topographic effects. These observed patterns appear to be similar to flat surfaces with just higher thermal inertia.
4.3.3. Case of MUPUS and MIRO
Temperature measurements by MUPUS on board of the Rosetta lander Philae, especially radiometer data detailed in Fig. 2 in Spohn et al. (2015), which landed in a depression beneath fractured cliffs (Bibring et al. 2015), showed a dichotomy in the temperature decline during obscuration times. Fitting efforts resulted in a relatively high thermal inertia of 85 ± 35 J m-2 K-1 s− 1 / 2. While effective latitude and heliocentric distance during measurements (3.0 AU) deviate widely, its temperature pattern resembles the calculation results depicted in Fig. 11 for fracture A2. Unbalanced peak temperatures in the cavity are leveled out fast after passing into shadows, the emissive cooling towards space during the whole night-side obscuration describes a much slower process. The thermal inertia fitting as proposed is not able to resolve these enlacing effects.
We therefore consider MIRO measurements of 15− 30 J m-2 K-1 s− 1 / 2 to be the most reliable source (Schloerb et al. 2015) for deriving thermophysical surface properties. We conclude from the MUPUS radiometer measurement fittings to our temperature curves, however, that our basic assumptions for fractures are justified.
4.3.4. Solid-state greenhouse effect?
Antenna temperature measurements by MIRO (Gulkis et al. 2015) further indicated that the rough consolidated terrain (in which fractures prevail) outlines a higher thermal inertia than the flat airfall areas.
One possible explanation is a higher surface roughness, but we wish to add a second interpretation that can contribute to explain the wide discrepancies between model and observational temperatures obtained for remote-sensing of comet Tempel 1 (Groussin et al. 2013). Our porous dust thermal model uses an effective heat conductivity mostly driven by radiation, thus thermal inertia is highly temperature-dependent. Combined with geometrical concave fractures, we obtain a solid-state greenhouse effect, hence lower cooling rates and therefore higher temperatures in the night. We estimate that it will nevertheless be difficult to ascertain by spectral imaging in the infrared whether fractures are inert or volatile-rich for the day- and night-side: the cooling rate, and hence the observed temperature of fracture geometries, has a large bandwidth.
4.4. Activity and outgassing patterns of 67P
4.4.1. Comparison of outgassing observations and modelling
Is there a link between outgassing patterns, active regions, and the prevalence of fractured terrain? Patches of surface water-ice were detected on a few barely illuminated spots (Pommerol et al. 2015; Filacchione et al. 2016), leaving most of the uppermost nucleus layers bare of water ice during most of a diurnal period (De Sanctis et al. 2015). The peak outgassing of H2O was detected in the neck area (Biver et al. 2015), apparently, the concave nucleus topography contributed to the focussing of the observed gas concentration. These findings were confirmed by VIRTIS (Bockelée-Morvan et al. 2015), with Hapi and Seth being primary H2O sources. The night side, despite low temperatures (<120 K), showed a small but not negligible amount of outgassing, which contributes to less than 10% to the overall H2O production (Biver et al. 2015).
Our analysis of different sublimation front depths at a heliocentric distance of 3.5 AU outlined that the deeper the ice is buried in the nucleus, the lower the sublimation rate. This effect is more pronounced for flat terrain than for fractures (Fig. 15), whose peak sublimation rates are 2−3 times higher than corresponding flat areas when we consider the fracture bottom wb alone. Normalised to the fracture top width wt, the considered fractures emit less H2O than flat terrain. The average diurnal sublimation rates of flat terrain outline values between 2.4 × 10⁻⁶ kg m-2 s-1 and 4.1 × 10⁻⁷ kg m-2 s-1 dependent on the sublimation front depth (surfacial to 5 mm), while the considered fractures A2 and A6 emit a smaller fraction that lies between 0.3 to 0.8. Deeper sublimation fronts yield higher relative values. When applied to a total production rate of 1.2 kg s-1 (Gulkis et al. 2015) at 3.5 AU of the nucleus, we can conclude that a perpendicularly illuminated area of roughly 1 km2 suffices to explain the diurnal outgassing behaviour of 67P. However, flat terrains produce more.
Furthermore, the ability of fractured terrain to retain thermal energy (as discussed in Sect. 4.1) allows for low but non-negligible outgassing rates during night times. These calculated outgassing rates show a bandwidth of between 9.2 × 10⁻⁸ kg m-2 s-1 for narrow fractured terrain and a sublimation front depth of 3 mm, and 5.9 × 10⁻¹⁰ kg m-2 s-1 for surfacial ice at the bottom of shallower fracturised areas; all values were obtained for local midnight and normalised to the top width wt of the fractures. Thus, an area of 1 km2 at local midnight conditions is sufficient to reproduce the night-side outgassing observed by MIRO (Biver et al. 2015), while comparable flat terrain outgassing is several orders of magnitude lower.
We conclude that models of fractured terrains can reproduce observed outgassing patterns on both night- and day-side in favour of flat terrains when we assume that roughly 5% of the surface is active. Apparently, more than 5% of the surface of 67P is fractured terrain.
DSMC coma models that used a non-uniform H2O source area approach (Fougere et al. 2016) found the best correlation to observations (Bockelée-Morvan et al. 2015) for increased outgassing from Hapi at higher heliocentric distances. The neck area, considering its topographic similarity to a fracture (only on a different scale), acts as heat trap, as displayed in Fig. 14.
4.4.2. Dust jet activity and fractured terrain
The first dust jets, resolved and linked to surfaces on 67P, were observed by Rosetta in July 2014 at 3.7 AU heliocentric distance (Lara et al. 2015). The sources of the reported jets are restricted to areas in the concave neck area. High-resolution observations revealed that they consist of small filament-like structures (Vincent et al. 2016) that tend to originate from consolidated fractured terrain. Because the neck area is concave, observers at large distances have the impression of a single large jet. Adjacent shadows allowed the detection of localised faint dust activity in late August at 3.5 AU (Sierks et al. 2015), originating from highly structured and fractured sink hole walls. The local irradiation conditions are composed of direct illumination and self-heating thermal emission from opposing sink hole walls; the self-heating prevents these walls from cooling down fast.
Activity models that postulate dust lift-off to overcome particle cohesion, gravity, or both (Kührt & Keller 1994; Skorov & Blum 2012; Blum et al. 2014; Gundlach et al. 2015) require high sublimation pressures, hence high water production rates infer small heliocentric distances to explain dust jet activity evoked by water ice alone. At 3.5 AU, dust particles of 4 μm constitute the maximum liftable grains (Davidsson et al. 2010, their Table 3) if water is the dominant volatile material, and the nucleus shows homogeneous outgassing that matches observations. Gundlach et al. (2015) concluded that water-ice sublimation alone cannot lift dust agglomerates at 3.5 AU for an assumed flat terrain, while OSIRIS observations described the cometary coma to be populated with particles of millimeter to centimeter sizes.
These models did not account for topographic peculiarities of cometary surfaces. Our modelling approach confirmed an increase in peak sublimation rate for fractures with volatile floors, the varied parameters only affected the ratio of sublimation rates, but not the general trend. When we assume material properties such as the composition of the surface and its cohesive strength to be similar for flat and fractured terrain, dust activity should emerge from the latter, especially at larger heliocentric distances simply because of the higher sublimation rates obtained here.
The higher sublimation rates obtained for fractures do not entirely close the gap to explain dust lift-off. Additional physical mechanisms, such as thermal cracking or gas drag in nozzle-like fractures, can add to the likelihood of emerging dust jets (Vincent et al. 2016). We estimate from the correlation of observations to our modelling results that an energy consumption for sublimation of >50 W m-2, which corresponds to a sublimation rate of 1.8 × 10⁻⁵ kg m-2 s-1, should enable the potential of a mixture of water ice and dust to trigger dust jet activity (Fig. 15).
4.5. Consequences for fracture evolution
Thermal fatigue is a considerable source for regolith formation on near-Earth asteroids (Delbo et al. 2014). El-Maarry et al. (2015b) concluded that temperature variations might drive the formation process, and derived maximum temperature changes of 15 K/min for flat terrain under extreme conditions. Ali-Lagoa et al. (2015) suggested that the reason for early activity restricted to the neck region are the vast temperature fluctuations. The special illumination conditions with short insolation and shadowing phases favour thermal cracking of the surface material layers.
After they form, fractures are subject to thermophysical conditions that clearly distinguish them from flat terrain:
-
1.
Absolute temperatures, temperature gradients, and diurnalvariations are strongest for wide inert fractures and weakest forsurface ice sublimating in thin cracks.
-
2.
Enhanced heat fluxes to the interior can lead to higher temperatures, hence allow for a sublimation zone at greater depths.
-
3.
Generally, fracture peak sublimation rates are higher, but total diurnal volatile losses tend to be lower.
These differences might affect the evolution of fractures. A possible scenario of fracture evolution that relies on these findings could be that devolatilisation of surface layers preferentially takes place in direct vicinity of fractures, as they tend to be warmer. The inert remaining material is more likely to be weakened through thermal fatigue, and removed by gas drag. Such fractures then tend to grow in both depth and width; the direction of the gravity vector, especially at cliff walls, can influence this by supporting material removal.
We found out that the fracture geometry that supports the highest relative sublimation rates depends on the illumination conditions. Possible evidence for fracture evolution through illumination then should be found in differences in fracture morphology between northern and southern hemispheres. The axial tilt of 67P is 52°, and it passed its equinox in May 2015, three months before perihelion in August (Mottola et al. 2014). The higher latitudes of the northern hemisphere receive most of its insolation at heliocentric distances beyond 1.5 AU, while the southern hemisphere is dominated by insolation during the perihelion passage (Keller et al. 2015b). As noted in Fig. 14, the dominance of the relative sublimation rate of heat traps sinks with closer approach to the Sun. Fractured terrains on the southern hemisphere should appear more mature: the fractures of the southern hemisphere are believed to show a higher width-to-depth ratio, as sublimation of the walls according to our results will be stronger. Sublimation rates from fracture walls are high enough to contribute to significant mass-loss rates and vapour pressures suffice to explain dust lift-off not only from the fracture floor.
If erosive losses drive the evolution of fractures, we would expect that fractures aligned with the Sun passing above them are evolving faster. Such fractures then should in general show larger dimensions than fractures that are perpendicular to them. Our analysis expects fractures in ideal illumination conditions to grow about a meter per perihelion passage. Quantifying fracture growth per orbit is not possible without a better estimate of the physical and mechanical properties of the material in fractured areas, which will be derived from multi-instrument analysis when all Rosetta data are available. A detailed comparison of pre- and post-perihelion fracture patterns in various areas, coupled with this thermal model, will be performed in a future work.
5. Conclusions
The OSIRIS camera on board Rosetta unveiled fractures and fracture-strewn patterns on various consolidated rough terrains on 67P/CG. Especially cliff structures that form the rims of pits and slopes can be linked to cometary dust jet activity at higher heliocentric distances. These are in their great majority covered by fractures or furrows, seldom icy patches are located below the pits and slopes. In order to better understand whether and to which extent these fractures can lead to enhanced sublimation and perhaps dust activity, we initiated a thermophysical model and varied several decisive thermophysical parameters, such as thermal inertia, fracture geometry, and location of the H2O ice.
We analysed several geometrical and illumination patterns for a full diurnal period at several heliocentric distances of 67P. We found that for all considered circumstances of well-illuminated areas, the analysed fractures remained unsusceptible to parameter variations and showed higher peak sublimation rates than flat terrain. The observed heat-trap effect is mostly caused by the low ability of concavities to radiate heat into deep space. Integrated diurnal devolatilisation is higher when the fractures are fully icy, and fracture walls contribute more than the bottom areas. The relative sublimation rate of H2O, normalised in comparison to flat terrain with identical properties concurrently increases with deeper sublimation front locations. This result is obtained for all heliocentric distances.
We showed that the thermodynamics of fractures on comet 67P can explain some aspects of dust and gas activity in favour of simple flat terrains. Sublimation attains values >50 W / m2 at 3.5 AU heliocentric distance, which appear to trigger dust activity that is mainly related to H2O. The presence of gaseous water in the night-side coma can be explained with the existence of fractures that still sublimate during night times, while flat terrain outgassing is quenched around sunset.
A high degree of surface roughness, inherently attributed to fractured terrain, affects the thermal inertia that is derived for 67P by remote sensing. The derived mechanisms and interpretations can be adapted qualitatively to other volatile species and comets. Especially unexpectedly high night-side temperatures, as revealed for 9P/Tempel 1, can be well explained with fractures that according to their small solid angle view factor towards space, outline low cooling rates. Future work will focus on the temporal evolution of fractures, including application of the parametrised models on precise fractured terrains on comet 67P.
Acknowledgments
OSIRIS was built by a consortium led by the Max-Planck-Institut für Sonnensystemforschung, Göttingen, Germany, in collaboration with CISAS, University of Padova, Italy, the Laboratoire d’Astrophysique de Marseille, France, the Instituto de Astrofisica de Andalucia, CSIC, Granada, Spain, the Scientific Support OCE of the European Space Agency, Noordwijk, The Netherlands, the Instituto Nacional de Tecnica Aeroespacial, Madrid, Spain, the Universidad Politecnica de Madrid, Spain, the Department of Physics and Astronomy of Uppsala University, Sweden, and the Institut für Datentechnik und Kommunikationsnetze der Technischen Universität Braunschweig, Germany. The support of the national funding agencies of Germany (DLR), France (CNES), Italy (ASI), Spain (MINECO), Sweden (SNSB), and the ESA Technical Directorate is gratefully acknowledged. We thank the Rosetta Science Ground Segment at ESAC, the Rosetta Mission Operations Centre at ESOC and the Rosetta Project at ESTEC for their outstanding work enabling the science return of the Rosetta Mission. The first author also wishes to thank the MPS for funding a research stipend, B. Gundlach for the helpful discussions of the application of his porous aggregate model, ITP Engines UK for providing a Ph.D. student research license of ESATAN-TMS (https://www.esatan-tms.com), which was used in this analysis, and the MPS Solar Orbiter Team for the funding of this licence. The authors gratefully acknowledge the referee work of Nalin Samarasinha, whose comments were very helpful in increasing the quality of this paper.
References
- A’Hearn, M. F. 2008, Space Sci. Rev., 138, 237 [NASA ADS] [CrossRef] [Google Scholar]
- Ali-Lagoa, V., Delbo, M., & Libourel, G. 2015, ApJ, 810, 5 [NASA ADS] [CrossRef] [Google Scholar]
- Belton, M. J. S. 2010, Icarus, 210, 881 [NASA ADS] [CrossRef] [Google Scholar]
- Benkhoff, J., & Spohn, T. 1991, Geophys. Res. Lett., 18, 261 [NASA ADS] [CrossRef] [Google Scholar]
- Bibring, J.-P., Langevin, Y., Carter, J., et al. 2015, Science, 349, 671 [Google Scholar]
- Biver, N., Hofstadter, M., Gulkis, S., et al. 2015, A&A, 583, A1 [NASA ADS] [CrossRef] [EDP Sciences] [Google Scholar]
- Blum, J., Gundlach, B., Mühle, S., & Trigo-Rodriguez, J. M. 2014, Icarus, 235, 156 [NASA ADS] [CrossRef] [Google Scholar]
- Bockelée-Morvan, D., Debout, V., Erard, S., et al. 2015, A&A, 583, A6 [NASA ADS] [CrossRef] [EDP Sciences] [Google Scholar]
- Brin, G., & Mendis, D. 1979, ApJ, 229, 402 [NASA ADS] [CrossRef] [Google Scholar]
- Capria, M. T. 2002, Earth, Moon and Planets, 89, 161 [NASA ADS] [CrossRef] [Google Scholar]
- Colangeli, L., Brucato, J. R., Hudson, R. L., & Moore, M. H. 2004, in Comets II, No. 1 (Tucson: University of Arizona Press), 695 [Google Scholar]
- Colwell, J. E., Jakowsky, B. M., Sandor, B. J., & Stern, S. 1990, Icarus, 85, 205 [NASA ADS] [CrossRef] [Google Scholar]
- Cowan, J., & A’Hearn, M. 1979, Moon and Planets, 21, 155 [NASA ADS] [CrossRef] [Google Scholar]
- Davidsson, B. J., & Rickman, H. 2014, Icarus, 243, 58 [NASA ADS] [CrossRef] [Google Scholar]
- Davidsson, B. J., & Skorov, Y. V. 2002, Icarus, 159, 239 [NASA ADS] [CrossRef] [Google Scholar]
- Davidsson, B. J. R., Gulkis, S., Alexander, C., et al. 2010, Icarus, 210, 455 [NASA ADS] [CrossRef] [Google Scholar]
- Davidsson, B. J. R., Gutiérrez, P. J., Groussin, O., et al. 2013, Icarus, 224, 154 [NASA ADS] [CrossRef] [EDP Sciences] [Google Scholar]
- Davidsson, B. J. R., Rickman, H., Bandfield, J. L., et al. 2015, Icarus, 252, 1 [NASA ADS] [CrossRef] [Google Scholar]
- De Sanctis, C. M., Capaccioni, F., Ciarniello, M., et al. 2015, Science, 525, 500 [Google Scholar]
- Delbo, M., Libourel, G., Wilkerson, J., et al. 2014, Nature, 508, 233 [NASA ADS] [CrossRef] [Google Scholar]
- El-Maarry, M. R., Thomas, N., Giacomini, L., et al. 2015a, A&A, 583, A1 [NASA ADS] [CrossRef] [EDP Sciences] [Google Scholar]
- El-Maarry, M. R., Thomas, N., Marschall, R., et al. 2015b, Geophys. Res. Lett., 42, 5170 [Google Scholar]
- Farnham, T. L., Bodewits, D., Li, J. Y., et al. 2013, Icarus, 222, 540 [NASA ADS] [CrossRef] [Google Scholar]
- Filacchione, G., de Sanctis, M., Capaccioni, F., et al. 2016, Nature, 529, 368 [NASA ADS] [CrossRef] [Google Scholar]
- Fougere, N., Altwegg, K., Berthelier, J.-J., et al. 2016, A&A, 588, A134 [NASA ADS] [CrossRef] [EDP Sciences] [Google Scholar]
- Fulle, M., Corte, V. D., Rotundi, A., et al. 2015, ApJ, 802, L12 [NASA ADS] [CrossRef] [Google Scholar]
- Groussin, O., A’Hearn, M. F., Li, J.-Y., et al. 2007, Icarus, 187, 16 [NASA ADS] [CrossRef] [Google Scholar]
- Groussin, O., Sunshine, J. M., Feaga, L. M., et al. 2013, Icarus, 222, 580 [CrossRef] [Google Scholar]
- Groussin, O., Jorda, L., Auger, A., et al. 2015, A&A, 583, A1 [NASA ADS] [CrossRef] [EDP Sciences] [Google Scholar]
- Grün, E., Gebhard, J., Bar-Nun, A., et al. 1993, J. Geophys. Res.: Planets, 98, 15091 [Google Scholar]
- Gulkis, S., Allen, M., von Allmen, P., et al. 2015, Science, 347, 709 [CrossRef] [Google Scholar]
- Gundlach, B., & Blum, J. 2012, Icarus, 219, 618 [NASA ADS] [CrossRef] [EDP Sciences] [Google Scholar]
- Gundlach, B., Skorov, Y. V., & Blum, J. 2011, Icarus, 213, 710 [NASA ADS] [CrossRef] [Google Scholar]
- Gundlach, B., Blum, J., Keller, H. U., & Skorov, Y. V. 2015, A&A, 583, A1 [NASA ADS] [CrossRef] [EDP Sciences] [Google Scholar]
- Gutiérrez, P., Ortiz, J., Rodrigo, R., & López-Moreno, J. 2000, A&A, 355, 809 [NASA ADS] [Google Scholar]
- Hässig, M., Altwegg, K., Balsiger, H., et al. 2015, Science, 347, 2 [CrossRef] [Google Scholar]
- Huetter, E. S., Koemle, N. I., Kargl, G., & Kaufmann, E. 2008, J. Geophys. Res., 113, E12004 [NASA ADS] [CrossRef] [Google Scholar]
- Ivanova, A., & Shulman, L. 2002, Earth, Moon and Planets, 90, 249 [CrossRef] [Google Scholar]
- Keller, H. U., Arpigny, C., Barbieri, C., et al. 1986, Nature, 321, 320 [NASA ADS] [CrossRef] [Google Scholar]
- Keller, H. U., Barbieri, C., Lamy, P., et al. 2007, Space Sci. Rev., 128, 433 [NASA ADS] [CrossRef] [Google Scholar]
- Keller, H., Mottola, S., Skorov, Y., & Jorda, L. 2015a, A&A, 579, L5 [NASA ADS] [CrossRef] [EDP Sciences] [Google Scholar]
- Keller, H. U., Mottola, S., Davidsson, B., et al. 2015b, A&A, 583, A1 [NASA ADS] [CrossRef] [EDP Sciences] [Google Scholar]
- Kieffer, H., Martin, T., Peterfreund, A., et al. 1977, J. Geophys. Res., 82, 4249 [NASA ADS] [CrossRef] [Google Scholar]
- Klinger, J. 1999, Adv. Space Res., 23, 1309 [NASA ADS] [CrossRef] [Google Scholar]
- Kömle, N. I., & Dettleff, G. 1991, Icarus, 89, 73 [NASA ADS] [CrossRef] [Google Scholar]
- Krebl, B. L., & Kömle, N. I. 2014, Planet. Space Sci., 87, 46 [NASA ADS] [CrossRef] [Google Scholar]
- Kührt, E., & Keller, H. U. 1994, Icarus, 109, 121 [NASA ADS] [CrossRef] [Google Scholar]
- La Forgia, F., Giacomini, L., Lazzarin, M., et al. 2015, A&A, 583, A1 [NASA ADS] [CrossRef] [EDP Sciences] [Google Scholar]
- Lagerros, J. S. V. 1998, A&A, 332, 1123 [NASA ADS] [Google Scholar]
- Lara, L. M., Lowry, S., Vincent, J., et al. 2015, A&A, 583, A1 [NASA ADS] [CrossRef] [EDP Sciences] [Google Scholar]
- Leyrat, C., Erard, S., Capaccioni, F., Tosi, F., & Filacchione, G. 2015, in Geophysical Research Abstracts, 17, 9767 [Google Scholar]
- Lowry, S., Duddy, S. R., Rozitis, B., et al. 2012, A&A, 548, A1 [NASA ADS] [CrossRef] [EDP Sciences] [Google Scholar]
- Mottola, S., Lowry, S., Snodgrass, C., et al. 2014, A&A, 569, 1 [Google Scholar]
- Mottola, S., Arnold, G., Jaumann, R., et al. 2015, Science, 349, 1 [CrossRef] [Google Scholar]
- Pajola, M., Vincent, J.-b., Güttler, C., et al. 2015, A&A, 583, A1 [NASA ADS] [CrossRef] [EDP Sciences] [Google Scholar]
- Pajola, M., Oklay, N., Forgia, F. L., et al. 2016, A&A, 592, A69 [NASA ADS] [CrossRef] [EDP Sciences] [Google Scholar]
- Pommerol, A., Thomas, N., El-Maarry, M. R., et al. 2015, A&A, 583, A1 [NASA ADS] [CrossRef] [EDP Sciences] [Google Scholar]
- Preusker, F., Scholten, F., Matz, K., et al. 2015, A&A, 583, A1 [NASA ADS] [CrossRef] [EDP Sciences] [Google Scholar]
- Prialnik, D., Benkhoff, J., & Podolak, M. 2004, Comets II, 1, 359 [NASA ADS] [Google Scholar]
- Rodionov, A., Crifo, J.-F., Szegő, K., Lagerros, J., & Fulle, M. 2002, Planet. Sp. Sci., 50, 983 [NASA ADS] [CrossRef] [Google Scholar]
- Rosenberg, E. D., & Prialnik, D. 2010, Icarus, 209, 753 [NASA ADS] [CrossRef] [Google Scholar]
- Rotundi, A., Sierks, H., Della Corte, V., et al. 2015, Science, 347, 3905 [Google Scholar]
- Saari, J. M., & Shorthill, R. W. 1963, Icarus, 2, 115 [NASA ADS] [CrossRef] [Google Scholar]
- Schloerb, F. P., Keihm, S., Allmen, P. V., et al. 2015, A&A, 583, A1 [NASA ADS] [CrossRef] [EDP Sciences] [Google Scholar]
- Schulz, R., Hilchenbach, M., Langevin, Y., et al. 2015, Nature, 518, 216 [NASA ADS] [CrossRef] [Google Scholar]
- Sekanina, Z. 2004, Science, 304, 1769 [NASA ADS] [CrossRef] [PubMed] [Google Scholar]
- Sierks, H., Rickman, H., Keller, H. U., Agarwal, J., & Hearn, M. F. A. 2015, Science, 347, aaa1044 [Google Scholar]
- Skorov, Y., & Blum, J. 2012, Icarus, 221, 1 [NASA ADS] [CrossRef] [Google Scholar]
- Skorov, Y., Kömle, N. I., Keller, H. U., Kargl, G., & Markiewicz, W. J. 2001, Icarus, 153, 180 [NASA ADS] [CrossRef] [Google Scholar]
- Skorov, Y. V., Lieshout, R. V., Blum, J., & Keller, H. U. 2011, Icarus, 212, 867 [NASA ADS] [CrossRef] [EDP Sciences] [Google Scholar]
- Spohn, T., Knollenberg, J., Ball, A. J., et al. 2015, Science, 349, aab0464 [NASA ADS] [CrossRef] [Google Scholar]
- Squires, R., & Beard, D. 1961, ApJ, 133, 657 [NASA ADS] [CrossRef] [Google Scholar]
- Syal, M. B., Schultz, P. H., Sunshine, J. M., et al. 2013, Icarus, 222, 610 [NASA ADS] [CrossRef] [Google Scholar]
- Thomas, N., Davidsson, B., Fornasier, S., et al. 2015a, A&A, 583, A1 [NASA ADS] [CrossRef] [EDP Sciences] [Google Scholar]
- Thomas, N., Sierks, H., Barbieri, C., et al. 2015b, Science, 347, 1 [Google Scholar]
- Vincent, J., Böhnhardt, H., & Lara, L. M. 2010, A&A, 512, A1 [CrossRef] [EDP Sciences] [Google Scholar]
- Vincent, J.-B., Oklay, N., Pajola, M., et al. 2016, A&A, 587, A14 [NASA ADS] [CrossRef] [EDP Sciences] [Google Scholar]
- Weissman, P., & Kieffer, H. 1981, Icarus, 47, 302 [NASA ADS] [CrossRef] [Google Scholar]
- Weissman, P., & Kieffer, H. 1984, J. Geophys. Res., 358 [Google Scholar]
All Tables
Model parameters of monomers, aggregates, and the nucleus surface layer structure for application in the effective thermal conductivity for porous dust layers composed of aggregates.
All Figures
|
Fig. 1 Selected fractured areas on comet 67P/Churyumov-Gerasimenko, on Image NAC_2014-09-14T16.21.40.802Z_ID30_1397549001_F41. Panel a: Overview of the Ma’at regional morphology, according to El-Maarry et al. (2015a). Panel b: Fractures at the tops and sides of escarpments or cliffs. Panel c: Fracture networks. Panel d: Fractures on inclined terrain, grouped with similar-width orientation. See El-Maarry et al. (2015b) for the abundance and classification of fracture morphologies. |
| In the text | |
|
Fig. 2 Three different illumination conditions of the same fractured outcrop, the dominating fracture in the centre shows characteristics of a slingshot. |
| In the text | |
|
Fig. 3 Parametric model definition for a generic fracture: a) plane definitions, b) schematic nodal breakdown of a parametrised fracture with radiative heat exchange (red arrows) and effective conductive thermal fluxes (blue arrows), and c) solar plane with respect to the rotational axis of 67P at equinox. |
| In the text | |
|
Fig. 4 Temperature-dependent effective thermal conductivities for thermophysical parameter cases 1–4: R denotes the radius of the agglomerates according to rA in Table 4, case 4 assumes a high porosity of 85% by lowering the fill factor of the agglomerate structure to 0.3. For comparison: lunar regolith is of the order of 0.001 W/mK. |
| In the text | |
|
Fig. 5 Heat flux patterns for fracture A4 at a heliocentric distance of 2.0 AU and a plane angle η = 30° for one diurnal period of 12.4 h. The vertical lines at 0 h and 6.2 h indicate local morning and evening terminator. The coarse dotted grey line denotes the incident total solar irradiation, while the smaller black dotted line outlines the absorbed heat flux by the fracture floor. The grey continuous line shows the self-heating by infrared radiation, emitted from the fracture side walls, which impinges on the fracture floor: a positive value indicates a net heat flux direction towards the fracture floor. The grey dashed line illustrates the heat exchange with underlying nucleus layers through conductive and radiative transport. The black dashed line marks the local heat sink by sublimation phase change processes. For comparison, the dash-dotted line marks the sublimation pattern of a flat surface with identical thermophysical properties. The sublimation front is located directly at the surface of the fracture floor. Remarks: (1) the heat fluxes are related to 1 m2 sublimating fracture floor. Owing to the concave structure of geometry A4 and the decreasing width with depth, the fracture top sums up to 4 m2; (2) the fractured terrain absorbs about 4% more thermal energy than a flat surface because scattered irradiation is absorbed. |
| In the text | |
|
Fig. 6 Calculated diurnal temperatures for flat terrain and for the bottom of fracture geometry A4. The heliocentric distance is 2.0 AU, the plane angle is η = 30°, and the sublimation front is identical with the surface. The displayed fracture temperatures are averaged values over the four most central node positions at the fracture bottom, and 10 mm below it. |
| In the text | |
|
Fig. 7 Diurnal absorbed solar irradiation and sublimation fluxes for fractures A1, A4, and A8. The fracture floor sublimation front is located directly at the surface node. The vertical line at 6.2 h denotes the evening terminator. |
| In the text | |
|
Fig. 8 Normalised peak sublimation rate as a function of fracture wall angle, analysed for 16 fracture geometries. The diurnal peak sublimation rate is normalised to that of a flat surface with identical illumination and thermo-physical properties, and the same area as the fracture bottom. The circles denote calculated values, the lines show interpolating cubic functions. The dashed line depicts fracture geometries A1–A8 with a bottom width-to-height ratio of 0.1, the dash-dotted line B1–B4 and the dotted line C1–C4. All calculations were performed for 2.0 AU heliocentric distance, a plane angle of 30°, and a surfacial sublimation front. |
| In the text | |
|
Fig. 9 Normalised total diurnal sublimation energy, integrated over one diurnal period, displayed as a function of the fracture wall angle and analysed for four illumination scenarios. The sublimation energy is normalised to the total irradiated energy in all areas of the fracture. The circles denote calculated values, the lines show the trend employing cubic interpolation functions. All calculations were performed for 2.0 AU heliocentric distance and surface ice at the fracture floor only. The grey line indicates the total sublimation energy for a flat surface, if we assume that parts of the surface are inert: the sublimating area of the flat terrain equals the ratio between bottom and top width wb/wt. |
| In the text | |
|
Fig. 10 Diurnal irradiation and sublimation fluxes for fully subliming fractures A2 and A6. The grey dotted line shows the solar irradiation for one diurnal revolution at 2 AU as a positive heat source, the sublimation heat sinks are depicted for two sublimation fronts of 1 mm and 5 mm depth. The vertical line at 6.2 h denotes the terminator. |
| In the text | |
|
Fig. 11 Calculated diurnal surface temperatures for flat terrain terrain (dashed) and for fracture floor geometry A4 (inert: continuous; icy floor: dotted). The sublimation front is located at a depth of 1 mm (grey) and 5 mm (black). The heliocentric distance is 2.0 AU, the plane angle is η = 30°, and the sublimation front is identical to the surfacial node. Fracture temperatures are averaged over the four most central node positions at the fracture bottom. |
| In the text | |
|
Fig. 12 Normalised total diurnal sublimation energy as a function of the sublimation front depth. The sublimation front in the fracture floor is analysed for four different surface layer material properties (aggregate radius rA and porosity Φ) and hence effective thermal conductivities (see Fig. 4). The sublimation energy is normalised to that of a flat surface with identical properties and the same area as the fracture bottom floor. The circles and rectangles denote calculated values, with the lines being cubic interpolated data. All calculations were performed for 2.0 AU heliocentric distance, a solar plane angle of 30°, and two fracture geometries: A2 and A6. |
| In the text | |
|
Fig. 13 Fracture A4 floor temperatures for five heliocentric distance settings with surfacial sublimation. The vertical line at 6.2 h denotes the terminator. |
| In the text | |
|
Fig. 14 Peak sublimation rate as a function of fracture wall angle for five heliocentric distance settings, normalised to an identical flat surface. The circles and rectangles denote calculated values, and the lines show cubic interpolation functions. All calculations were performed for a solar plane angle of 30° and surface sublimation at the fracture bottom. |
| In the text | |
|
Fig. 15 Diurnal sublimation rates for a sublimation front at the surface and at a depth of 3 mm calculated for a heliocentric distance of 3.5 AU. The solar irradiation pattern for a flat surface is shown in comparison (boldface, dashed line); values are restricted to the 6.2 h in direct illumination conditions. Fractures A2 (dotted line) and A6 (dashed line) have sublimating floors. All calculations were performed for a solar plane angle of 30° and sublimation originating only from the fracture bottom. |
| In the text | |
|
Fig. 16 Diurnal temperature changes for fractures A2, A6, and a flat surface. The fracture is fully inert without any sublimation. The vertical line at 6.2 h denotes the terminator. |
| In the text | |
|
Fig. 17 Diurnal hemispherical brightness temperatures of flat and fracture geometries A2 and A6 for different sublimation patterns. The heliocentric distance is 2.0 AU, the plane angle is η = 30°, and the sublimation front is identical to the surfacial node. The dotted line shows the brightness temperature for flat terrains (sublimating and inert), while fracture geometries A2 (grey) and A6 (black) in three different configurations are displayed: for completely inert (dashed), sublimation of both bottom and walls (dash-dotted), and pure fracture floor/bottom sublimation. |
| In the text | |
Current usage metrics show cumulative count of Article Views (full-text article views including HTML views, PDF and ePub downloads, according to the available data) and Abstracts Views on Vision4Press platform.
Data correspond to usage on the plateform after 2015. The current usage metrics is available 48-96 hours after online publication and is updated daily on week days.
Initial download of the metrics may take a while.