Fig. A.1
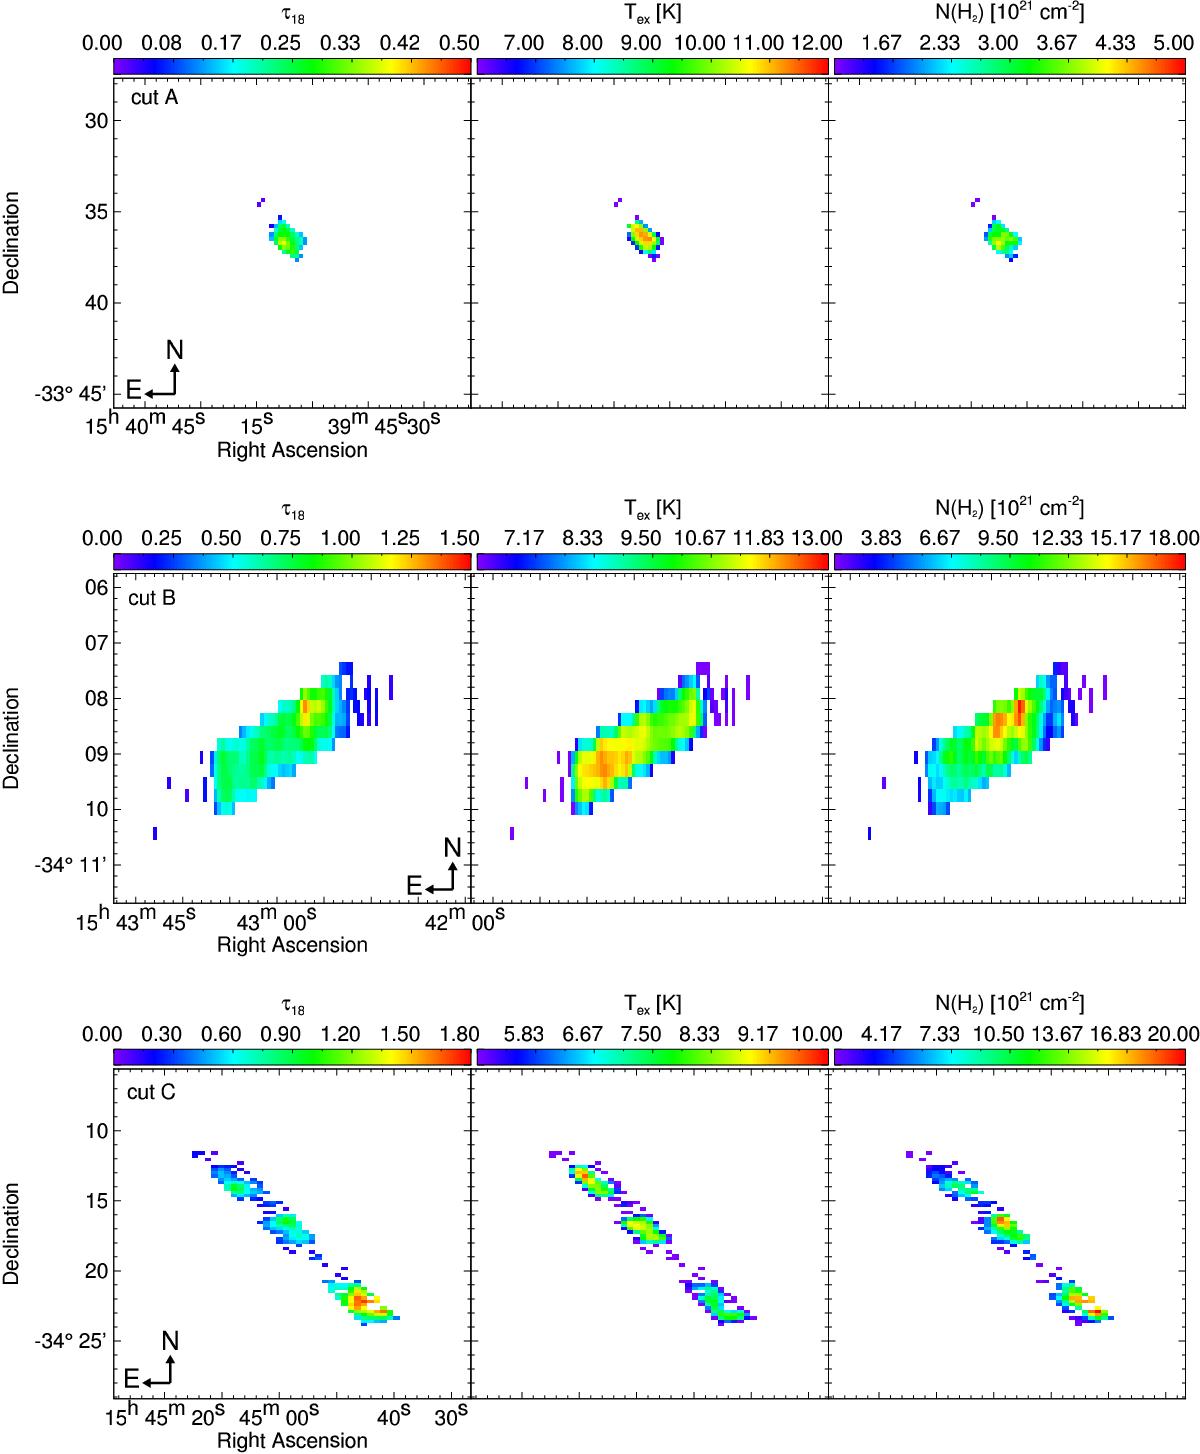
Results of the LTE analysis for cut A, B, and C (from top to bottom). The left panel shows the optical depth τ18 , the middle panel the excitation temperature Tex , and the right panel the H2column density. All maps were convolved with a Gaussian of two pixels that corresponds approximatively to the beam size. Pixels within each cut for which the 13CO(2–1)and the C18O(2–1)spectrum had a S/N< 4 are left blank.
Current usage metrics show cumulative count of Article Views (full-text article views including HTML views, PDF and ePub downloads, according to the available data) and Abstracts Views on Vision4Press platform.
Data correspond to usage on the plateform after 2015. The current usage metrics is available 48-96 hours after online publication and is updated daily on week days.
Initial download of the metrics may take a while.