Fig. 8
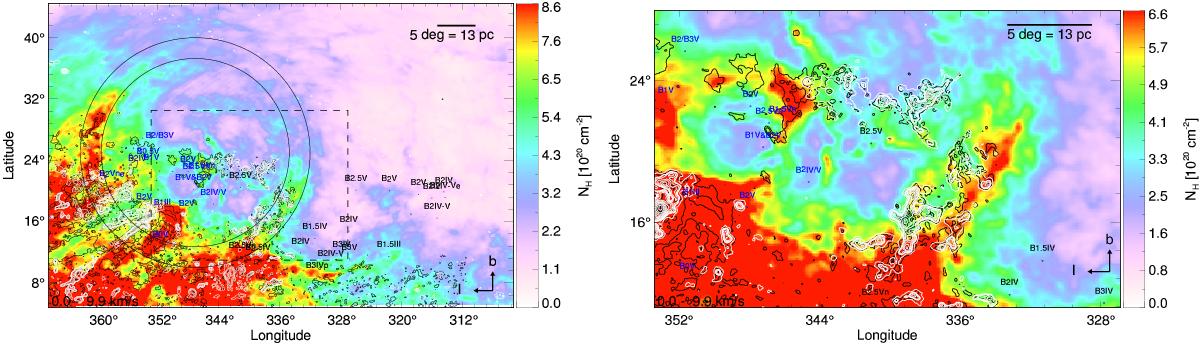
Left: H i column density map of USco and surroundings of Lupus Icalculated from the integrated emission for vLSR = 0–10 km s-1. The two black circles indicate the inner and outer radius of the USco shell from the model fit. The black and white contours represent the dust emission at 850 μm and the CO(1–0)emission from Planck, respectively. The blue and black labeled dots represent early B-type stars in USco and UCL, respectively. Right: zoom into the region indicated as a dashed black box in the left panel.
Current usage metrics show cumulative count of Article Views (full-text article views including HTML views, PDF and ePub downloads, according to the available data) and Abstracts Views on Vision4Press platform.
Data correspond to usage on the plateform after 2015. The current usage metrics is available 48-96 hours after online publication and is updated daily on week days.
Initial download of the metrics may take a while.