Fig. 7
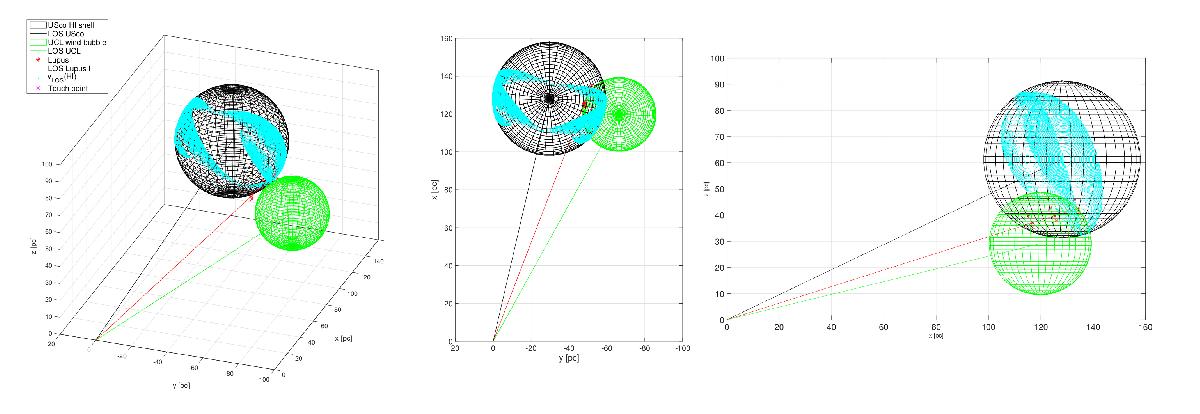
Geometrical model of the possible interaction zone between the USco H i shell (black sphere) and UCL wind bubble (green sphere). The observer is located in the origin of the coordinate system. The position of Lupus Iis marked by three red asterisks that represent the top, middle, and bottom of the main filament, respectively. The cloud is plotted at three different distances of 150, 140, and 130 pc along the red line, which is the line of sight from us to Lupus I. The black and green solid lines are the line of sight from the observer to the corresponding sphere. The cyan dots indicate those positions on the USco shell that have line-of-sight velocities between 3 and 6 km s-1, i.e., similar to Lupus I(the white gaps are an effect of the grid model used in the calculations). The magenta cross indicates the touch point between the USco and the UCL sphere. The projections are show in the different panels.
Current usage metrics show cumulative count of Article Views (full-text article views including HTML views, PDF and ePub downloads, according to the available data) and Abstracts Views on Vision4Press platform.
Data correspond to usage on the plateform after 2015. The current usage metrics is available 48-96 hours after online publication and is updated daily on week days.
Initial download of the metrics may take a while.