Fig. 5
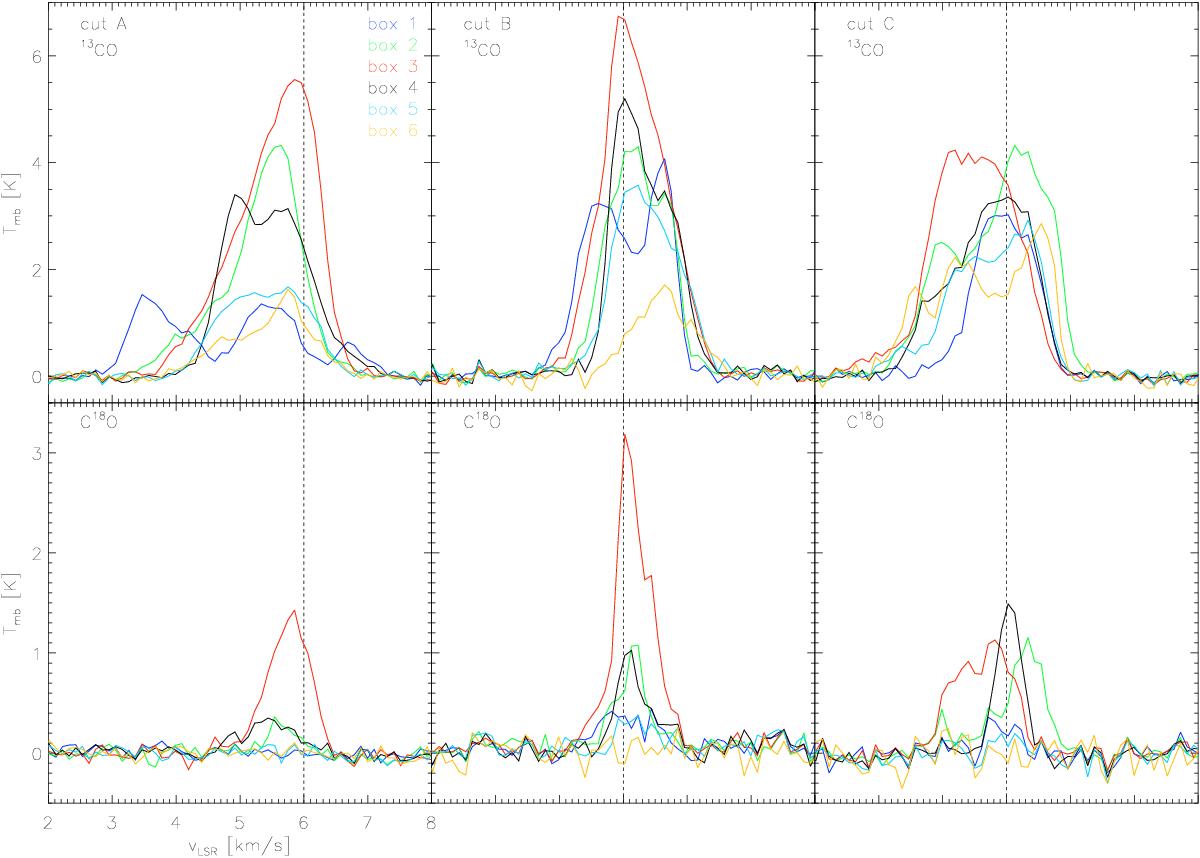
Averaged spectra within the six boxes into which each cut was divided. The top row shows the average 13CO(2–1)spectra; the bottom shows those of C18O(2–1). Each column represents one of the three cuts. The different colors denote the six boxes from 1 to 6. The vertical dashed line marks for orientation vLSR = 6 km s-1 for cut A and vLSR = 5 km s-1 for cuts B and C.
Current usage metrics show cumulative count of Article Views (full-text article views including HTML views, PDF and ePub downloads, according to the available data) and Abstracts Views on Vision4Press platform.
Data correspond to usage on the plateform after 2015. The current usage metrics is available 48-96 hours after online publication and is updated daily on week days.
Initial download of the metrics may take a while.