Fig. 3
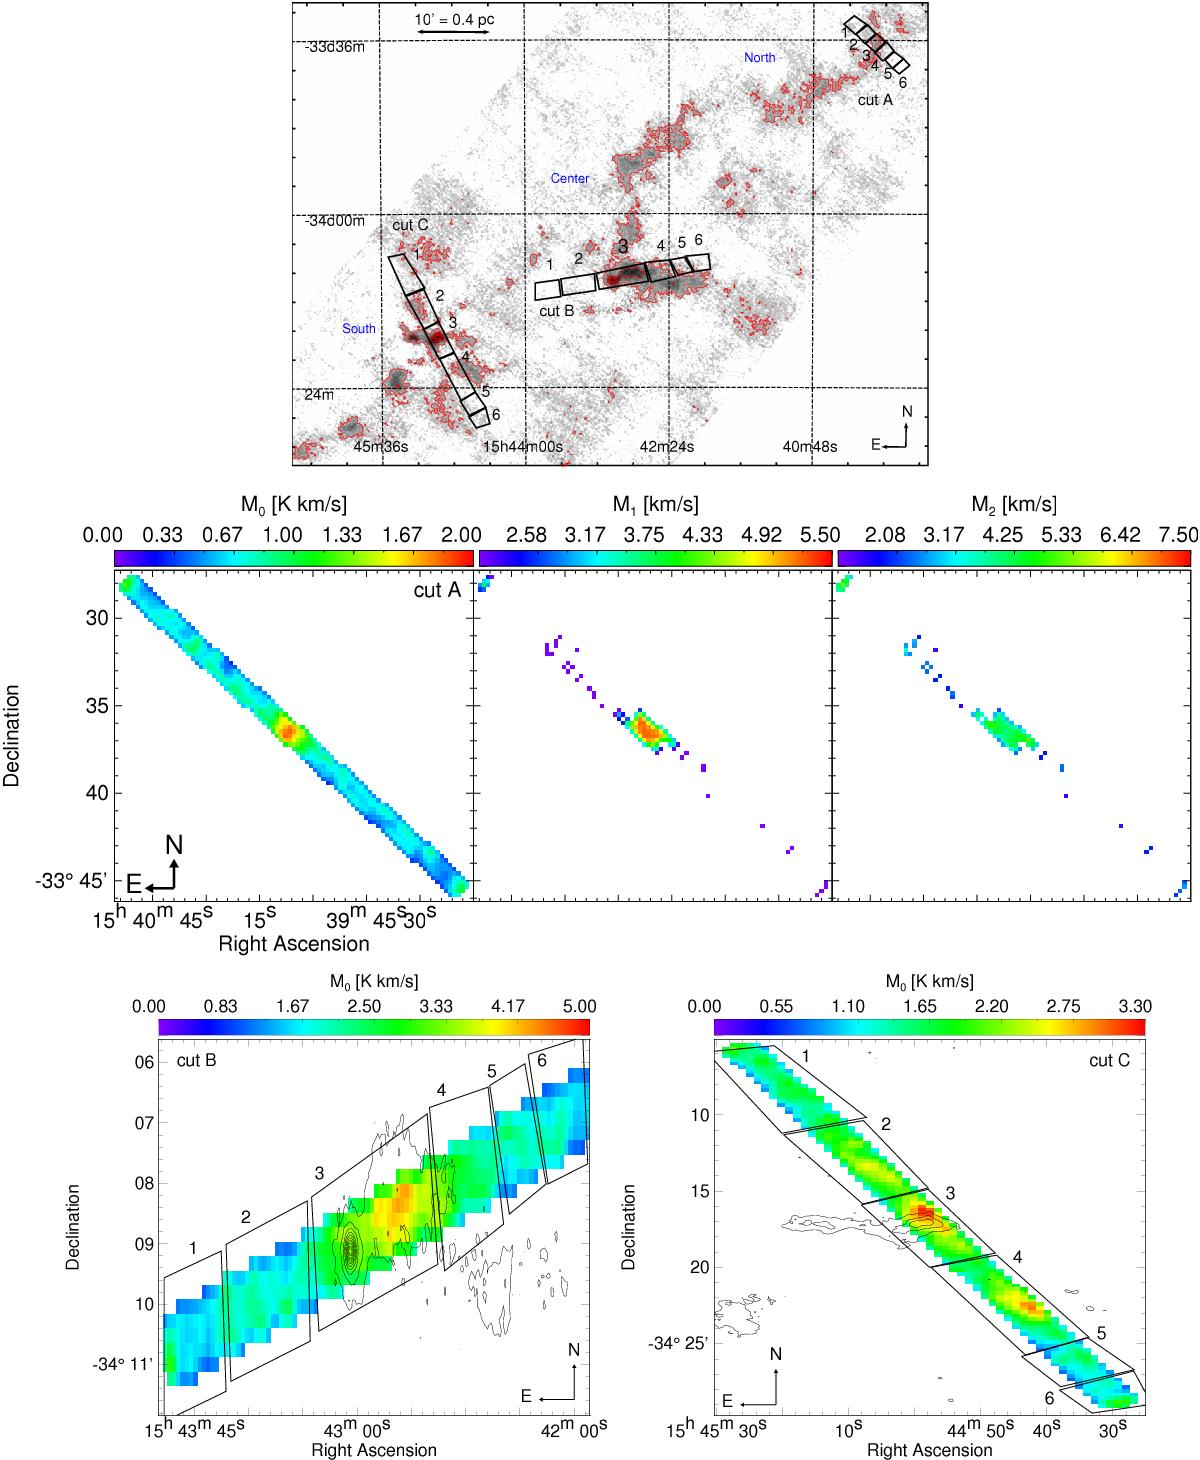
Top left: dust column density map from LABOCA with red contour levels of 0.3, 1, 1.7, 2.3, and 3 × 1022 cm-2 . Integrated C18O(2–1)intensity maps of cut A, B, and C (top rightand bottom figures, respectively). The six boxes into which each cut was divided are shown as well as the contours of the LABOCA 870 μm continuum emission. Levels are from 10–100% of the peak intensity of 1.37 Jy/beam.
Current usage metrics show cumulative count of Article Views (full-text article views including HTML views, PDF and ePub downloads, according to the available data) and Abstracts Views on Vision4Press platform.
Data correspond to usage on the plateform after 2015. The current usage metrics is available 48-96 hours after online publication and is updated daily on week days.
Initial download of the metrics may take a while.