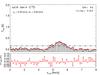
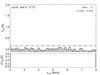
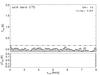
Fig. A.2
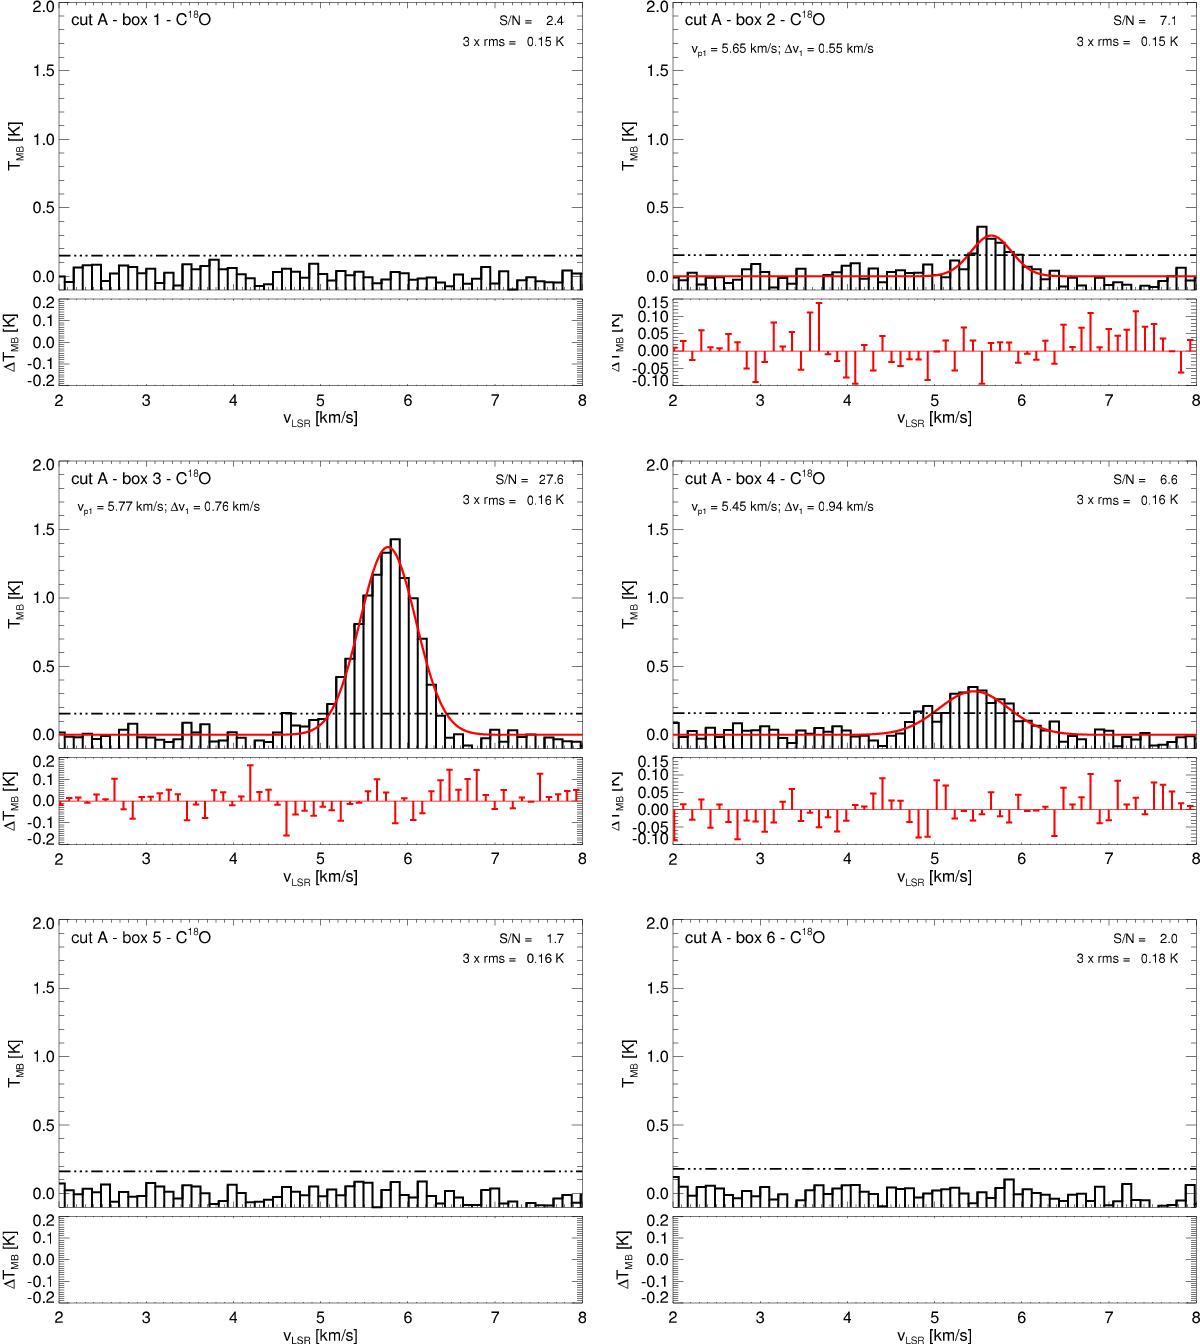
Histograms of the average C18O(2–1)spectra of the six boxes across cut A with a bin size of 0.1 km s-1. The black dash-dotted line indicates the 3×rms limit. The values of 3 ×rms and the signal-to-noise ratio S/N are given in the upper right of each plot. The red solid line shows the Gaussian fit to the spectrum. If more than one component was fitted, each of the components is represented by a blue dashed line and the red solid line is their sum. The residuals of the fit are given by the red bars in the small plot below each spectrum. Peak positions vpi and FWHM Δvi of each component in one box are given in the upper left of each plot. A summary of all these values can be found in Table 2, where they are denoted by an upper index G.
Current usage metrics show cumulative count of Article Views (full-text article views including HTML views, PDF and ePub downloads, according to the available data) and Abstracts Views on Vision4Press platform.
Data correspond to usage on the plateform after 2015. The current usage metrics is available 48-96 hours after online publication and is updated daily on week days.
Initial download of the metrics may take a while.