| Issue |
A&A
Volume 608, December 2017
|
|
|---|---|---|
| Article Number | C1 | |
| Number of page(s) | 1 | |
| Section | Cosmology (including clusters of galaxies) | |
| DOI | https://doi.org/10.1051/0004-6361/201526925e | |
| Published online | 08 December 2017 | |
Thermodynamic perturbations in the X-ray halo of 33 clusters of galaxies observed with Chandra ACIS (Corrigendum)
1 Max-Planck-Institut für extraterrestrische Physik, Giessenbachstraße, 85748 Garching, Germany
e-mail: This email address is being protected from spambots. You need JavaScript enabled to view it.
2 Department of Astrophysical Sciences, Princeton University, Princeton, NJ 08544, USA
3 Max-Planck-Institut für Astrophysik, Karl-Schwarzschildstraße, 85748 Garching, Germany
Key words: galaxies: clusters: general / X-rays: galaxies: clusters / turbulence / errata, addenda
Einstein and Spitzer Fellow.
Owing to an issue in the fitting program XSPEC version 12.8.21, the correlations of metallicity with redshift and temperature in Hofmann et al. (2016) need to be revised. The bug caused normalisation (η) and metallicity (Z) in the apec model to be a factor of ~ (1 + z) too low (z, redshift of the source).
The rest of our results are not affected by the bug since they are based on ratios of fit properties. In the published thermodynamic maps2, normalisation and metallicity need to be corrected by multiplying with a factor of about (1 + z), where z is the redshift of the respective cluster. This propagates into approximate corrections of density × (1 + z)1/2, pressure × (1 + z)1/2, and entropy × (1 + z)− 1/3.
We did a complete rerun of our analysis with XSPEC version 12.9.0o (bug fixed) and revised the correlations (see Fig. 1). The updated best-fit linear correlations of metallicity with temperature (T in keV) and redshift are (including 1σ uncertainties) written as  The slopes change as expected within the uncertainties. There is no significant correlation of metallicity and temperature between clusters anymore. The metallicity-redshift correlation has a reduced significance of ~ 1.7σ. The average metallicity of the sample stays the same within the uncertainties at Z ≈ (0.3 ± 0.1) Z⊙.
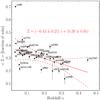 |
Fig. 1 Comparison of the cluster redshift z and the area- and error-weighted average 2D map metallicity measured in the intra-cluster medium (full radial range). The red line and equation show the best-fit linear correlation. Dashed lines indicate the 1σ scatter around the best fit. Error bars are the statistical uncertainty of the weighted average. |
References
- Hofmann, F., Sanders, J. S., Nandra, K., Clerc, N., & Gaspari, M. 2016, A&A, 585, A130 [NASA ADS] [CrossRef] [EDP Sciences] [Google Scholar]
© ESO, 2017
All Figures
|
Fig. 1 Comparison of the cluster redshift z and the area- and error-weighted average 2D map metallicity measured in the intra-cluster medium (full radial range). The red line and equation show the best-fit linear correlation. Dashed lines indicate the 1σ scatter around the best fit. Error bars are the statistical uncertainty of the weighted average. |
| In the text | |
Current usage metrics show cumulative count of Article Views (full-text article views including HTML views, PDF and ePub downloads, according to the available data) and Abstracts Views on Vision4Press platform.
Data correspond to usage on the plateform after 2015. The current usage metrics is available 48-96 hours after online publication and is updated daily on week days.
Initial download of the metrics may take a while.