Fig. 1
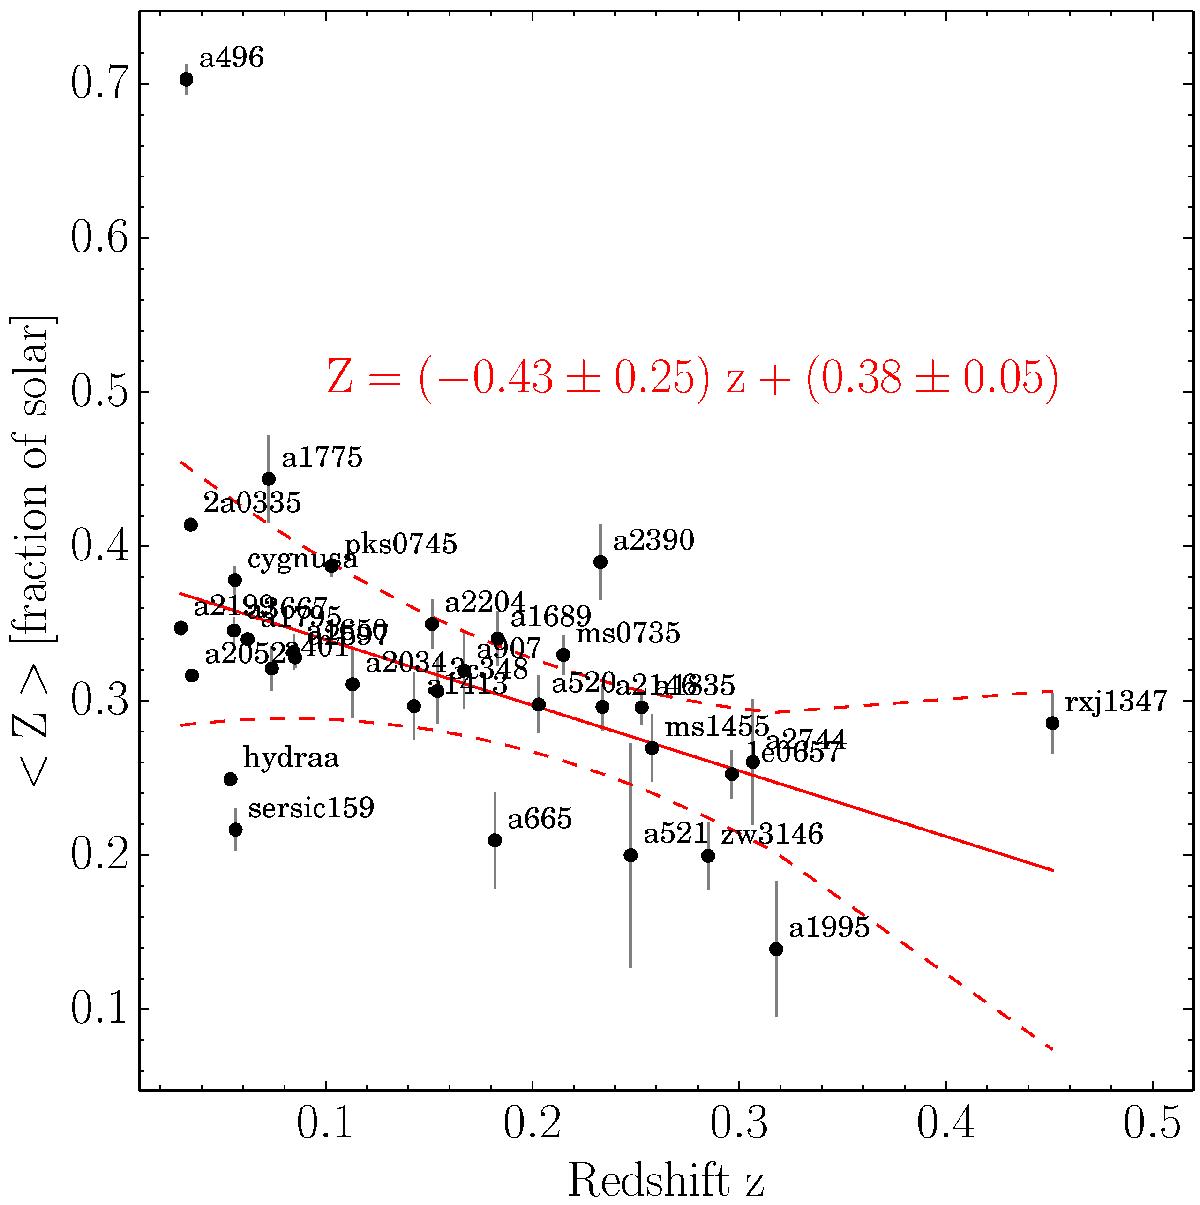
Comparison of the cluster redshift z and the area- and error-weighted average 2D map metallicity measured in the intra-cluster medium (full radial range). The red line and equation show the best-fit linear correlation. Dashed lines indicate the 1σ scatter around the best fit. Error bars are the statistical uncertainty of the weighted average.
Current usage metrics show cumulative count of Article Views (full-text article views including HTML views, PDF and ePub downloads, according to the available data) and Abstracts Views on Vision4Press platform.
Data correspond to usage on the plateform after 2015. The current usage metrics is available 48-96 hours after online publication and is updated daily on week days.
Initial download of the metrics may take a while.