Fig. A.1
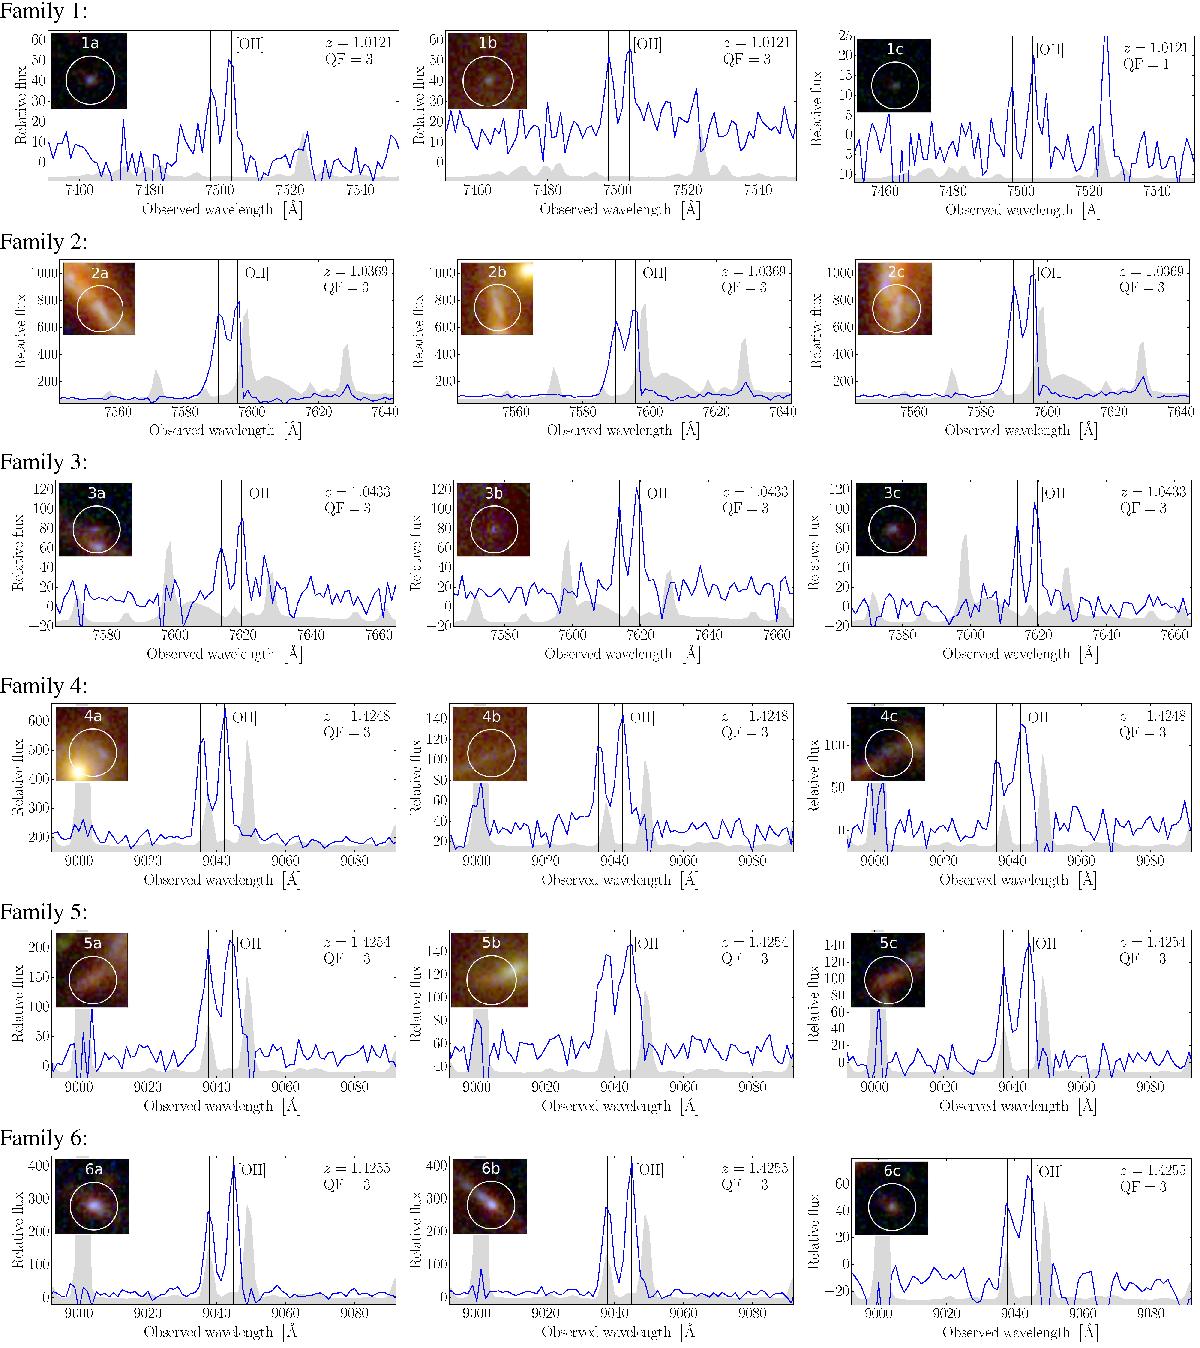
MUSE data of multiply lensed background sources of MACS 1206. The vertical black lines indicate the positions of the emission lines based on the best estimate of the systemic redshift. The gray area shows the rescaled variance obtained from the data reduction pipeline; the flux is given in units of 10-20 erg s-1 cm-2 Å-1. The image cutouts in each panel have 2″ across and are extracted from the CLASH color image. The white circles show the HST counterparts or are centered at the position of the MUSE emission in the cases of no apparent counterparts.
Current usage metrics show cumulative count of Article Views (full-text article views including HTML views, PDF and ePub downloads, according to the available data) and Abstracts Views on Vision4Press platform.
Data correspond to usage on the plateform after 2015. The current usage metrics is available 48-96 hours after online publication and is updated daily on week days.
Initial download of the metrics may take a while.