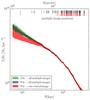
Fig. 8

Comparison of the total mass density profiles of MACS 1206 obtained from strong lensing models with different cluster mass parametrizations and sets of multiple images. The vertical lines indicate the projected radial distances from the cluster center of the multiple images presented in this work (in black) and a subset of them (in red). Upper panel: gray and green regions show, respectively, the profiles for the reference model P3ε and model G3ε. The red region shows the profile with the same cluster mass parametrization as for the reference model, obtained by excluding all multiple images within 70 kpc in projection of the cluster center except the innermost one. The errors correspond to the 95% confidence level and are estimated from 200 different models extracted from the corresponding MCMCs. Bottom panel: radial profiles of the relative difference in the cumulative projected total mass values obtained from the reference model P3ε and other models with different cluster mass parametrizations (δM = Mref−Mi), all employing the full set of multiple images. The gray regions show the statistical errors at the 68%, 95% and 99.8% confidence levels of the reference model.
Current usage metrics show cumulative count of Article Views (full-text article views including HTML views, PDF and ePub downloads, according to the available data) and Abstracts Views on Vision4Press platform.
Data correspond to usage on the plateform after 2015. The current usage metrics is available 48-96 hours after online publication and is updated daily on week days.
Initial download of the metrics may take a while.