Fig. 7
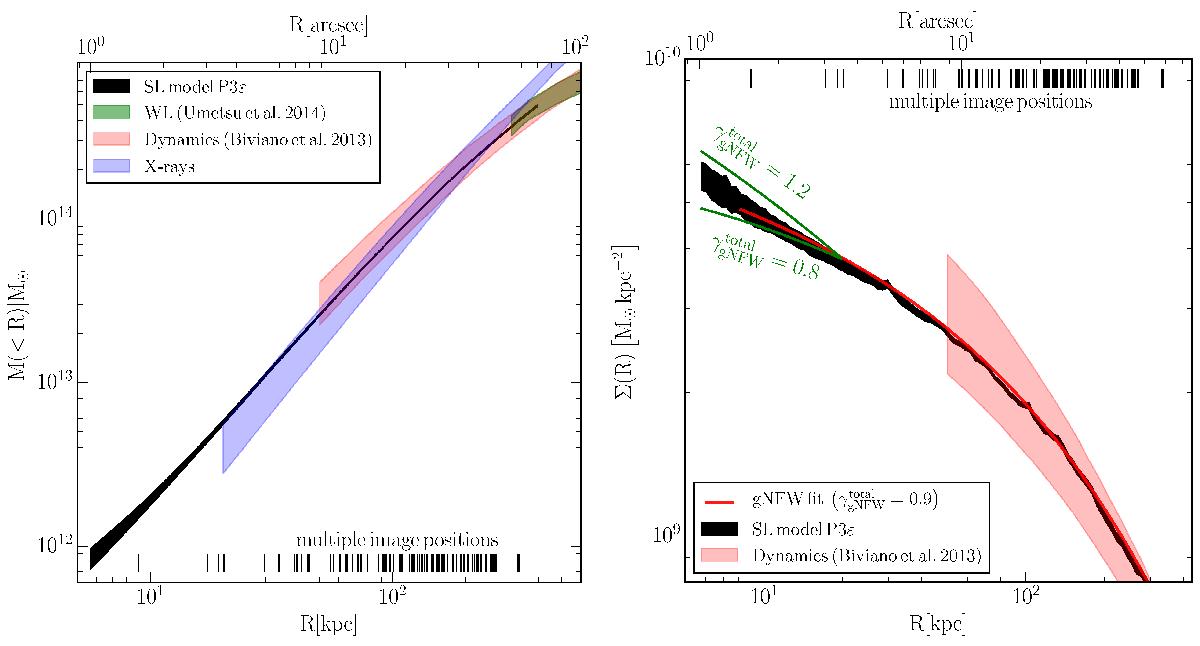
Comparison of different independent projected total mass determinations in MACS 1206. The black region represents the results at the 95% confidence level of our strong lensing analysis (reference model P3ε). At the 68% confidence level, the dynamical (Biviano et al. 2013), weak-lensing (Umetsu et al. 2014), and X-ray (see Sect. 4.2) total mass estimates are shown in red, green, and blue, respectively. The vertical lines indicate the projected radial distances from the cluster center of the multiple images presented in this work. The cumulative projected total mass profile is shown in the left panel. In the right panel we show the projected total surface mass density profile and the red line is a fit using a gNFW model. The green lines show two different gNFW profiles, with values of ![]() equal to 0.8 and 1.2, normalized at R = 20 kpc.
equal to 0.8 and 1.2, normalized at R = 20 kpc.
Current usage metrics show cumulative count of Article Views (full-text article views including HTML views, PDF and ePub downloads, according to the available data) and Abstracts Views on Vision4Press platform.
Data correspond to usage on the plateform after 2015. The current usage metrics is available 48-96 hours after online publication and is updated daily on week days.
Initial download of the metrics may take a while.