Fig. 4
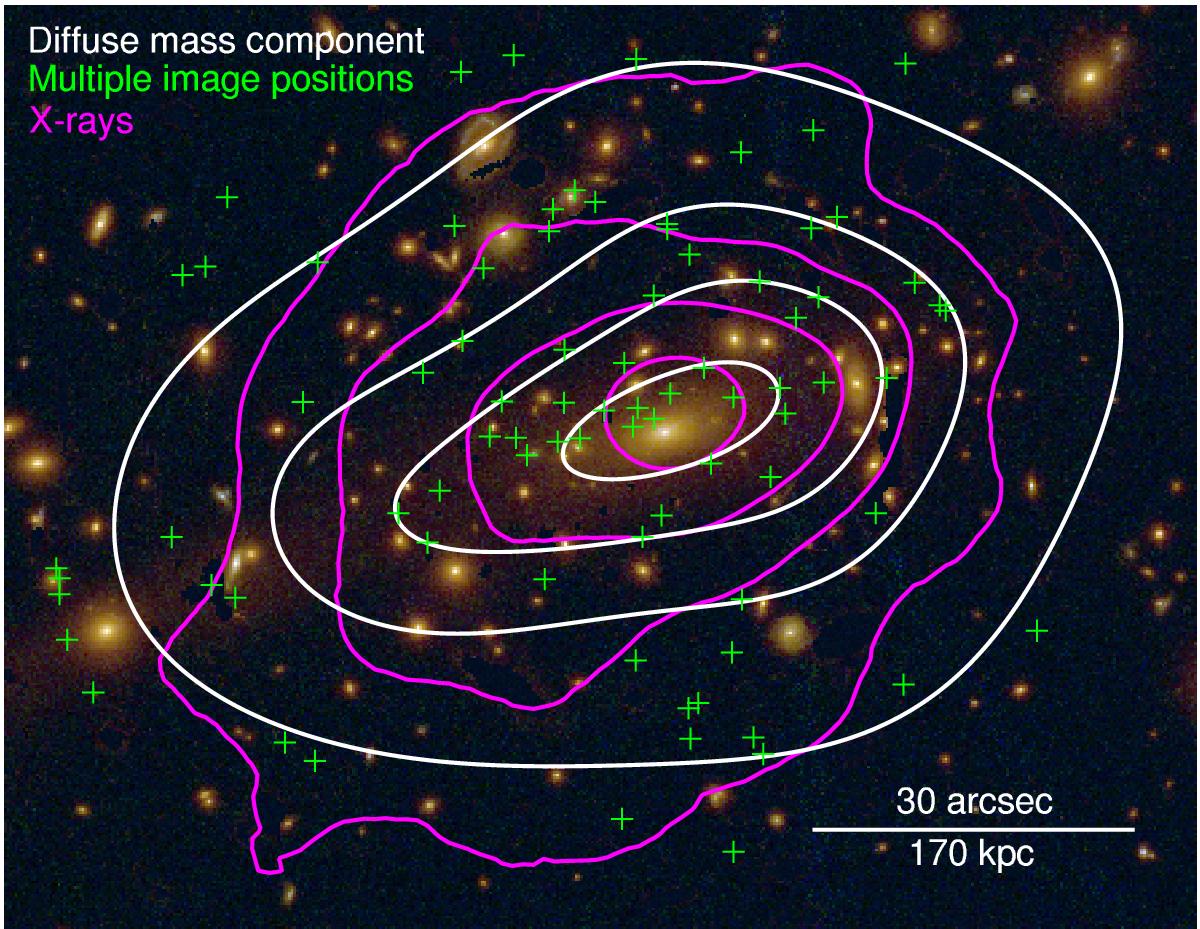
Cluster members of MACS 1206 used in the strong lensing models. Galaxies that do not satisfy the selection criteria described in Sect. 3.2.1 have been masked out of the original HST image using the SExtractor segmentation map. The white lines show the contour levels of the reconstructed surface mass density of the diffuse mass components only (obtained by removing the surface mass density of the cluster member halos from that of the total), corresponding to the values of [1.0,1.5,2.0,3.0] × 1015M⊙ Mpc-2. The magenta lines show the isocontours of the 0.5−7 keV Chandra X-ray detection. The green crosses indicate the positions of the multiple images shown with white and green circles in Fig. 1.
Current usage metrics show cumulative count of Article Views (full-text article views including HTML views, PDF and ePub downloads, according to the available data) and Abstracts Views on Vision4Press platform.
Data correspond to usage on the plateform after 2015. The current usage metrics is available 48-96 hours after online publication and is updated daily on week days.
Initial download of the metrics may take a while.