Fig. 3
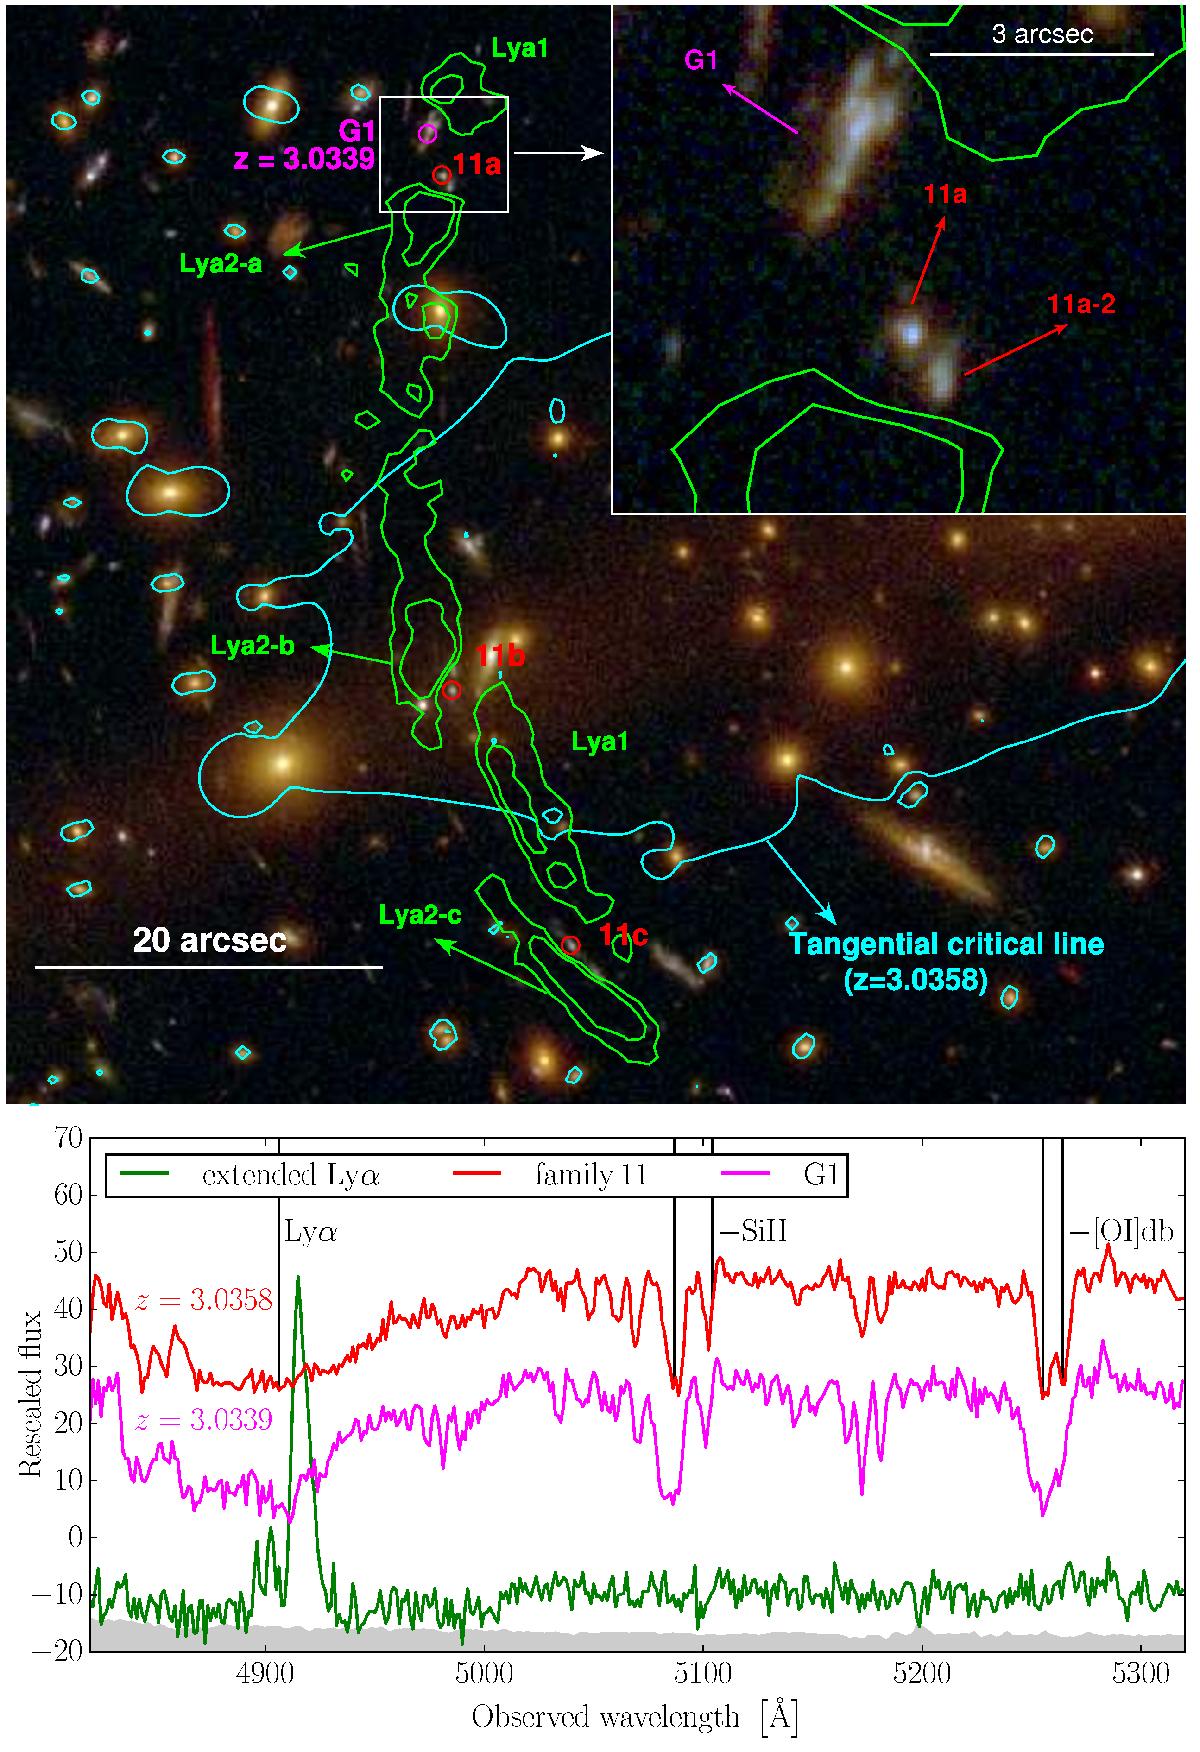
Top panel: Lyman-α extended emission (green contours) associated with the multiple images (red circles) of family 11. The cyan lines show the tangential critical curves at the redshift of family 11 (z = 3.0358). A galaxy very close angularly and in redshift (z = 3.0339), but singly imaged, is indicated with a magenta circle. Bottom panel: red and magenta lines show, respectively, the stacked spectrum of the multiple images of family 11, corrected for the magnification factor and shifted upwards by a factor of + 25 (flux units are 10-20 erg s-1 cm-2 Å-1), and the spectrum of the singly imaged galaxy. The green line shows the extended Lyman-α continuum-subtracted (to reduce the contamination from ICL) emission, extracted from the innermost green apertures. The magenta and green spectra have been rescaled by arbitrary factors for better visualization. The gray region represents the rescaled variance obtained from the data reduction pipeline.
Current usage metrics show cumulative count of Article Views (full-text article views including HTML views, PDF and ePub downloads, according to the available data) and Abstracts Views on Vision4Press platform.
Data correspond to usage on the plateform after 2015. The current usage metrics is available 48-96 hours after online publication and is updated daily on week days.
Initial download of the metrics may take a while.