Fig. 1
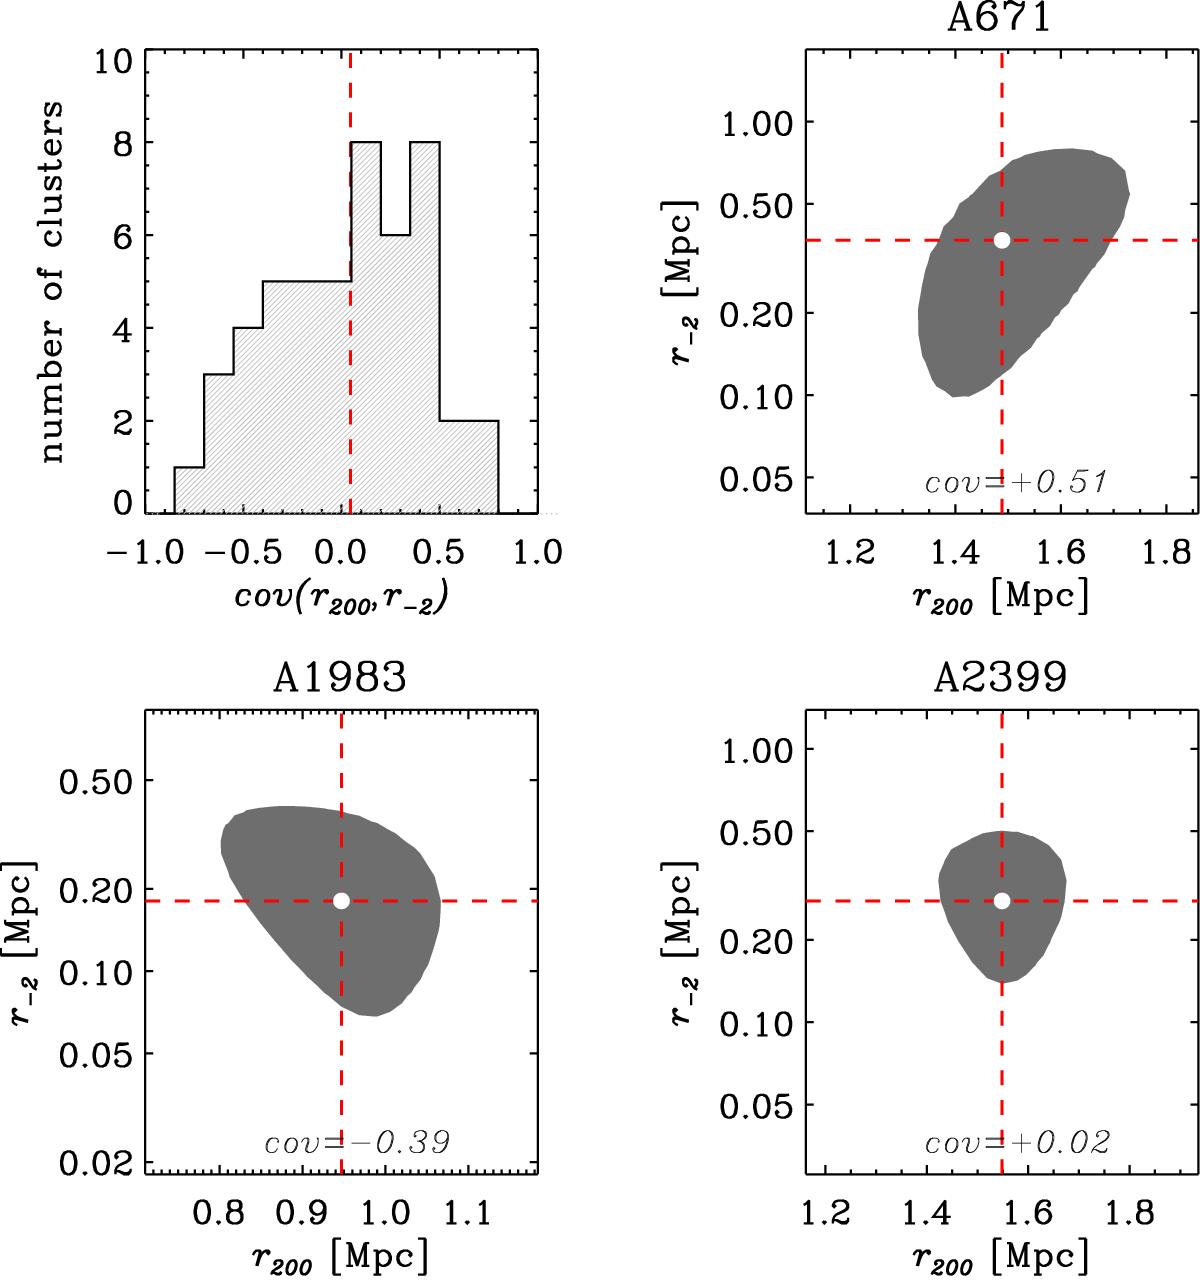
Top left panel: distribution of error covariance between the r200 and r-2 dynamical parameters. The mean of the distribution is indicated by a dashed vertical (red) line. Other panels: 68% confidence contours and best-fit values of the r-2 (y-axis) vs. r200 (x-axis) parameters of the MAMPOSSt analysis, in units of Mpc, for 3 of the 49 clusters analyzed. The best-fit solution is indicated by the dashed red lines and the white dot. The error covariance of the two parameters is listed at the bottom center of each panel.
Current usage metrics show cumulative count of Article Views (full-text article views including HTML views, PDF and ePub downloads, according to the available data) and Abstracts Views on Vision4Press platform.
Data correspond to usage on the plateform after 2015. The current usage metrics is available 48-96 hours after online publication and is updated daily on week days.
Initial download of the metrics may take a while.