| Issue |
A&A
Volume 607, November 2017
|
|
|---|---|---|
| Article Number | A28 | |
| Number of page(s) | 6 | |
| Section | Extragalactic astronomy | |
| DOI | https://doi.org/10.1051/0004-6361/201731175 | |
| Published online | 31 October 2017 | |
Chasing obscuration in type-I AGN: discovery of an eclipsing clumpy wind at the outer broad-line region of NGC 3783
1 SRON Netherlands Institute for Space Research, Sorbonnelaan 2, 3584 CA Utrecht, The Netherlands
e-mail: This email address is being protected from spambots. You need JavaScript enabled to view it.
2 Leiden Observatory, Leiden University, PO Box 9513, 2300 RA Leiden, The Netherlands
3 Space Telescope Science Institute, 3700 San Martin Drive, Baltimore, MD 21218, USA
4 Department of Physics, Virginia Tech, Blacksburg, VA 24061, USA
5 Department of Physics, Technion-Israel Institute of Technology, 32000 Haifa, Israel
6 Dipartimento di Matematica e Fisica, Università degli Studi Roma Tre, via della Vasca Navale 84, 00146 Roma, Italy
7 Mullard Space Science Laboratory, University College London, Holmbury St. Mary, Dorking, Surrey, RH5 6NT, UK
8 INAF–IASF Bologna, via Gobetti 101, 40129 Bologna, Italy
9 European Space Astronomy Centre, PO Box 78, 28691 Villanueva de la Cañada, Madrid, Spain
10 Department of Astronomy, University of Geneva, 16 Ch. d’Ecogia, 1290 Versoix, Switzerland
11 Nicolaus Copernicus Astronomical Center, Polish Academy of Sciences, Bartycka 18, 00-716 Warsaw, Poland
12 Department of Astronomy, The Ohio State University, 140 West 18th Avenue, Columbus, OH 43210, USA
13 Center for Cosmology & AstroParticle Physics, The Ohio State University, 191 West Woodruff Ave., Columbus, OH 43210, USA
14 Univ. Grenoble Alpes, IPAG, 38000 Grenoble, France
15 CNRS, IPAG, 38000 Grenoble, France
16 Institute of Astronomy, Madingley Road, CB3 0 HA Cambridge, UK
17 Max Planck Institute fur Extraterrestriche Physik, 85748 Garching, Germany
Received: 15 May 2017
Accepted: 12 July 2017
Abstract
In 2016 we carried out a Swift monitoring programme to track the X-ray hardness variability of eight type-I AGN over a year. The purpose of this monitoring was to find intense obscuration events in AGN, and thereby study them by triggering joint XMM-Newton, NuSTAR, and HST observations. We successfully accomplished this for NGC 3783 in December 2016. We found heavy X-ray absorption produced by an obscuring outflow in this AGN. As a result of this obscuration, interesting absorption features appear in the UV and X-ray spectra, which are not present in the previous epochs. Namely, the obscuration produces broad and blue-shifted UV absorption lines of Lyα, C iv, and N v, together with a new high-ionisation component producing Fe xxv and Fe xxvi absorption lines. In soft X-rays, only narrow emission lines stand out above the diminished continuum as they are not absorbed by the obscurer. Our analysis shows that the obscurer partially covers the central source with a column density of few 1023 cm-2, outflowing with a velocity of few thousand km s-1. The obscuration in NGC 3783 is variable and lasts for about a month. Unlike the commonly seen warm-absorber winds at pc-scale distances from the black hole, the eclipsing wind in NGC 3783 is located at about 10 light days. Our results suggest that the obscuration is produced by an inhomogeneous and clumpy medium, consistent with clouds in the base of a radiatively driven disk wind at the outer broad-line region of the AGN.
Key words: X-rays: galaxies / galaxies: active / galaxies: Seyfert / galaxies: individual: NGC 3783 / techniques: spectroscopic
© ESO, 2017
1. Introduction
Accretion onto supermassive black holes (SMBHs) in active galactic nuclei (AGN) is believed to be accompanied by outflows of gas, which couple the SMBHs to their environment. The observed associations between SMBHs and their host galaxies, such as the M–σ relation (Ferrarese & Merritt 2000), point to their co-evolution through a feedback mechanism. The AGN outflows may play an important role in this feedback as they can impact star formation, chemical enrichment of the intergalactic medium, and cooling flows in galaxy clusters (see e.g. the review by Fabian 2012). There are, however, significant gaps in our understanding of the outflow phenomenon in AGN.
Winds of photoionised gas (warm absorbers, hereafter WA) are commonly observed in bright AGN through high-resolution UV and X-ray spectroscopy (e.g. Crenshaw et al. 1999; Blustin et al. 2005). They often consist of multiple ionisation components, outflowing with velocities of typically a few hundred km s-1. From an observational point of view, other kinds of winds with different properties from WAs have been found in the X-ray band: high-ionisation ultra-fast outflows (e.g. PDS 456, Reeves et al. 2009) and obscuring outflows (e.g. NGC 5548, Kaastra et al. 2014). Compared to the common WAs at pc-scale distances from the black hole (e.g. Kaastra et al. 2012), the obscuring outflow found in NGC 5548 is a faster and more massive wind closer to the accretion disk. It produces strong absorption of the X-ray continuum, in addition to the appearance of blue-shifted and broad UV absorption lines. X-ray obscuration with associated UV line absorption has also been seen in Mrk 335 (Longinotti et al. 2013) and NGC 985 (Ebrero et al. 2016). Variable X-ray absorption is commonly found in type-I AGN: e.g. NGC 1365 (Rivers et al. 2015); PDS 456 (Matzeu et al. 2016); NGC 4151 (Beuchert et al. 2017); IRAS 13224-3809 (Parker et al. 2017). However, the association with the UV broad-line absorbing outflows is unclear. Moreover, the physical connection between different kinds of AGN outflow, and their origins and driving mechanisms, are still poorly understood. In this study we aim to address the nature and origin of an X-ray obscuration/eclipse through UV/X-ray spectroscopy of the absorption during an eclipsing event.
An efficient way to drive winds in quasars is via radiative acceleration of the gas through UV line absorption (e.g. Proga & Kallman 2004). However, intense X-ray radiation from the central source can over-ionise the gas, leaving insufficient line opacity to drive the wind. Shielding the UV-absorbing gas from the X-rays by an obscuring medium near the X-ray source (like that seen in NGC 5548) can prevent this. Thus, obscuration may play an important role in driving AGN outflows. A statistical study of X-ray variability by Markowitz et al. (2014) identifies obscuration events in AGN using RXTE observations. They find 12 X-ray eclipses in eight AGN, and compute a ~1% probability of finding a type-I AGN undergoing obscuration. However, the origin, location, and physical properties of such eclipses are poorly understood. It is also uncertain whether these eclipses are manifestations of disk winds in general. In order to broaden our understanding of this phenomenon, we have conducted a Swift monitoring programme on a sample of type-I AGN to catch an obscuration event, and to perform a ToO multiwavelength spectroscopic study of the event using XMM-Newton, NuSTAR, and HST COS.
2. Swift monitoring programme and triggering of XMM-Newton, NuSTAR, and HST observations
The X-ray spectral hardness variability is a useful indicator of obscuration. We define the hardness ratio (HR) as (H − S) / (H + S), where H and S are the Swift XRT count rates in the hard (1.5–10 keV) and soft (0.3–1.5 keV) bands, respectively. X-ray absorption by obscuring/eclipsing gas increases HR. During Swift Cycle 12 (April 2016–March 2017), we monitored eight suitable type-I AGN: Ark 564, MR 2251-178, Mrk 335, Mrk 509, Mrk 841, NGC 3783, NGC 4593, and NGC 7469. These AGN were observed weekly by Swift during the corresponding visibility windows of the four observatories. While most of the AGN displayed stable HR throughout the year, only NGC 3783 (triggered by us) and Mrk 335 (triggered earlier by another team) showed significant X-ray spectral hardening.
Figure 1 shows the Swift light curve of NGC 3783 from May 2016 to January 2017. In December 2016, we found an intense X-ray spectral hardening event that lasted for about 32 days. During this period we successfully executed the triggering of our XMM-Newton, NuSTAR, and HST observations (see Table A.1 in Appendix A). Figure 2 (upper panel) shows the 2016 XMM-Newton EPIC-pn and NuSTAR spectra, as well as the time-averaged EPIC-pn spectra from 2000 and 2001. Strong X-ray absorption is evident in the new data (see also the RGS data in Fig. 2, bottom panel); with the 0.3–2.0 keV flux dropping from 1.60 × 10⁻¹¹erg cm-2 s-1 in 2000–2001 by a factor of 8.0 (11 December 2016) and 4.5 (21 December 2016). This X-ray absorption coincides with an increase in the UV flux (Fig. 1). Strong line absorption affects the blue side of the C iv line profile in the 2016 HST/COS spectrum (Fig. 3), extending from the line centre to ~− 3200km s-1, with additional shallow absorption features present down to ~− 6200km s-1. Blue-shifted broad UV line absorption is also detected in Lyα and N v in the new COS spectra (Kriss et al., in prep.).
For a description of our data reduction, we refer to Appendix A in Mehdipour et al. (2015), which applies to the NGC 3783 data used here, with more details provided in our follow-up papers. The wavelength/energy bands used in our simultaneous X-ray spectral modelling of the data are 7–37 Å for RGS, 1.5–10 keV for EPIC-pn, and 10–80 keV for NuSTAR. The spectral modelling is performed using the SPEX package v3.03.01 (Kaastra et al. 1996). We use C-statistics for spectral fitting with X-ray spectra optimally binned according to Kaastra & Bleeker (2016). Errors are reported at the 1σ confidence level.
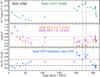 |
Fig. 1 Swift light curve of NGC 3783 from 17 May 2016 to 21 January 2017. The horizontal dotted lines in the two upper panels show the all-time average Swift flux levels. The dashed black line in the bottom panel indicates the average quiescent hardness ratio (HR) from unobscured data. The dashed line in red is the HR limit for triggering, above which significant obscuration was predicted according to our simulations. The first and second XMM-Newton observations are indicated by vertical dotted lines. |
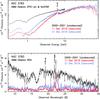 |
Fig. 2 NGC 3783 spectra from XMM-Newton EPIC-pn and NuSTAR (top panel), and XMM-Newton RGS (bottom panel). The displayed energy range for EPIC-pn is 0.3–10 keV and for NuSTAR 10–80 keV. |
3. Modelling of the obscuring wind in NGC 3783
For photoionisation modelling of the WA and the new obscurer, we determined the spectral energy distribution (SED) of the central ionising source in NGC 3783. We applied a template SED model that we reported in Mehdipour et al. (2015) for NGC 5548 to fit the NGC 3783 data and determine its SED. These Seyfert-1 AGN have a SED composition consisting of an optical/UV thin disk component, an X-ray power-law continuum, a neutral X-ray reflection component, and a warm Comptonisation component for the soft X-ray excess. The exponential cut-off energy of the power law was set to 340 keV (De Rosa et al. 2002), which is also consistent with the NuSTAR spectra. The Galactic X-ray absorption is modelled using the hot model in SPEX, with NH = 9.59 × 1020 cm-2 (Murphy et al. 1996). The redshift of NGC 3783 is set to 0.009730 (Theureau et al. 1998), and all abundances are fixed to the proto-solar values of Lodders et al. (2009). To correct for Galactic reddening, we used the ebv model, with E(B − V) = 0.107 (Schlafly & Finkbeiner 2011). To take into account the host galaxy optical/UV stellar emission, we used the galactic bulge model of Kinney et al. (1996), and normalised it to the NGC 3783 host galaxy flux measured from HST (Bentz et al. 2013). In the 12″ diameter circular aperture of OM, this is 7.04 × 10⁻¹⁵erg cm-2 s-1 Å-1 (Bentz, priv. comm.).
Before modelling the new strong absorption by the obscurer in the 2016 data, we first derived a model for the WA from archival observations, where the WA absorption features are clearly detectable in X-rays. Previous studies have found a WA in NGC 3783 (Kaspi et al. 2002; Blustin et al. 2002; Behar et al. 2003; Scott et al. 2014). We used all archival XMM-Newton data (2000 and 2001) and Chandra HETGS data (2000, 2001, and 2013) to produce a set of time-averaged spectra. The HETGS spectra were obtained from TGCat (Huenemoerder et al. 2011). For photoionisation and spectral modelling of the optically thin WA, we used the new pion model in SPEX (Mehdipour et al. 2016b). From modelling the NGC 3783 archival spectrum, we find that the WA spans a wide range of ionisation, similar to the distribution reported by Holczer et al. (2007) and Goosmann et al. (2016). We fit the absorption by the WA with multiple pion components, with outflow velocities ranging from 450 to 1200 km s-1. The narrow X-ray emission lines are also fitted with the pion model at zero net velocity. The total NH of the WA is derived to be about 4.0 × 1022cm-2. More details about this WA model will be reported by Mao et al. (in prep.).
The 2016 data suggest that the photoionised emission from the X-ray narrow line region is not absorbed by the obscurer. This is evident from the clear presence of narrow emission lines and radiative recombination edges in the RGS spectrum, such as the O viii Lyα at 19 Å and O vii triplet lines at 22 Å (Fig. 2, bottom panel). We make a reasonable assumption that the obscurer in NGC 3783 is likely located within the WA and the X-ray narrow line region. Previous studies find the WA in NGC 3783 to be at pc-scale distances from the black hole (e.g. Behar et al. 2003; Gabel et al. 2005). From our photoionisation modelling we find that the ionisation state and turbulent velocity of both the WA and the X-ray narrow line region match each other. These indicate that they are likely at similar distances from the black hole, albeit there are modelling uncertainties associated with this interpretation. In our line of sight, the WA is effectively shielded from receiving some of the ionising radiation, thus it becomes less ionised. This lower ionisation is directly evidenced by the increased absorption in the narrow UV outflow components in the 0 to − 1500km s-1 range of the COS spectra in Fig. 3. For the WA of NGC 3783 with an electron density of 3 × 104 cm-3 (Gabel et al. 2005), we find that the recombination timescale for relevant ions is ≲ 1 day. This means during the month-long obscuration event, the WA would be able to respond to the change in the ionising SED caused by the obscuration. Thus, we take into account the enhanced absorption by this de-ionised WA. The WA model obtained from the unobscured data is incorporated into our modelling of the new obscured data, with only the ionisation parameter ξ (Krolik et al. 1981) of the WA components self-consistently lowered by the obscuration.
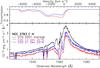 |
Fig. 3 NGC 3783 HST COS and STIS spectra near the C iv line. The line transmission model for the new broad C iv absorption component in 2016 is shown in the top panel. The displayed spectra are continuum subtracted and then offset vertically by 2.5 × 10⁻¹⁴erg cm-2 s-1 Å-1 for each epoch so that the weaker changes in the absorption are more visible. Narrow absorption lines in the blue wing are interstellar Si iiλ1526 and C ivλ1548,1551. |
Continuum absorption by the obscurer is too strong to leave detectable absorption lines in soft X-rays. Therefore, to set the velocity and ξ of the obscurer in our modelling, we use the broad UV absorption lines of the obscurer seen in the COS spectrum. The transmission model for the broad C iv line (Kriss et al., in prep.) is shown in Fig. 3, top panel. We use the weighted average velocity of the broad C iv absorption profile in our X-ray spectral modelling (vout = − 1900km s-1 and σv = 1100km s-1). The ionisation balance of the obscurer is derived using the Cloudy v13.04 photoionisation code (Ferland et al. 2013) for an optically thick medium, to match the UV lines in the COS spectrum, with its X-ray absorption fitted using the xabs model in SPEX. This is in order to produce the observed UV lines without a massive neutral hydrogen front as there are no significant detections of C ii and Si ii in the COS spectrum of NGC 3783. We obtain a solution at log ξ = 1.84 for the obscurer.
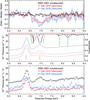 |
Fig. 4 Top panel: NGC 3783 EPIC-pn data fit residuals without absorption by a high-ionisation component (HC), showing new Fe xxv and Fe xxvi absorption lines in the 2016 obscured epoch. Middle panel: line transmission of the blue-shifted HC Fe xxv and Fe xxvi absorption lines (solid lines), shown with respect to the Fe Kα and Fe Kβ emission lines and the continuum unaffected by the HC line absorption (dotted lines). Bottom panel: EPIC-pn data and their best-fit model (dotted lines). |
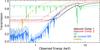 |
Fig. 5 Continuum and line transmission of all the absorption components in our line of sight towards the nucleus of NGC 3783. The solid lines correspond to Obs. 1, and the dotted lines to Obs. 2. |
To fit the 2016 obscured X-ray spectra we require two xabs absorption components to reproduce the observed curvature of the spectrum from soft to hard X-rays. The curvature seen in 2016 is not present in the archival spectra. The addition of the first and second xabs components improves the fit significantly with ΔC of about 4000 and 1000, respectively. Interestingly, we find evidence of a strong high-ionisation component (HC) in the 2016 data (see Fig. 4). The Fe xxvi Lyα line (E0 = 6.966 keV), blue-shifted by about − 2300km s-1, overlaps with the Fe Kβ emission line (E0 = 7.020 keV). This Fe xxvi absorption of the continuum causes the Fe Kβ emission line to vanish in 2016, while it is present in the archival data (Fig. 4). The addition of this HC component further improves the fit with ΔC of about 200. The X-ray transmission of all the absorption components in our line of sight to NGC 3783 are shown in Fig. 5. The final model fits the data well with C-stat/d.o.f. = 2288/1539 (Obs. 1) and 2285/1542 (Obs. 2). We note that the remaining fit residuals primarily belong to soft X-ray emission lines from the X-ray narrow line region. The modelling of these lines is independent of the obscurer. The obscurer itself is effectively featureless in X-rays (Fig. 5), detected only through continuum absorption and the characteristic curvature in the broadband X-ray continuum. The continuum is fitted well as there are no curvature residuals in our best-fit model (Fig. 6, bottom panel). The intrinsic photon index Γ of the underlying X-ray power-law continuum is found to be about 1.71 (Obs. 1) and 1.75 (Obs. 2). Our best-fit model to the data, and the corresponding SEDs, are displayed in Fig. 6. The best-fit parameters of the obscurer and the HC are given in Table 1.
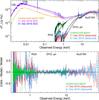 |
Fig. 6 Top panel: best-fit model to each dataset of NGC 3783, and its corresponding SED model. The displayed X-ray data include absorption by the Galaxy, the WA, and the obscurer. Bottom panel: residuals of the best-fit model. |
4. Discussion and conclusions
The strongly diminished soft X-rays and the appearance of new spectral features in NGC 3783 can be explained by an obscuring wind at the core of this AGN. The obscurer is found to consist of two partially-covering absorption components, suggesting that the obscuring medium is inhomogeneous and clumpy. A similar property was also found for the obscuring wind in NGC 5548 (Kaastra et al. 2014). However, in the case of NGC 5548, the obscuration has been going on for several years (Mehdipour et al. 2016a), while that in NGC 3783 was a short-lived eclipsing event, which lasted for about a month (Fig. 1). Moreover, the obscurer in NGC 3783 has a significantly higher ionisation parameter ξ and lower covering fraction Cf than the one in NGC 5548. These differences can be explained if the obscurer in NGC 5548 is a spatially extended stream of cool gas in our line of sight (Kaastra et al. 2014), while that in NGC 3783 is a hotter transient cloud, which is localised and closer to the central source.
Best-fit parameters of the two obscurer components and the new high-ionisation component (HC) for Obs. 1 (11 December 2016) and Obs. 2 (21 December 2016).
NGC 3783 has previously displayed X-ray spectral hardening in the archival Swift and RXTE data. There is a single obscured Swift observation in 2009, and Markowitz et al. (2014) identify four eclipsing events from the RXTE data. However, in 2016 we had the first opportunity to carry out a spectroscopic study of the obscuration with XMM-Newton, HST, and NuSTAR. Since the obscurer is found to partially cover the central X-ray source, we can assume it has a transverse size (d) comparable to that of the X-ray source. The transverse velocity (vt) required by the obscurer to eclipse the X-ray source is 2RX/t, where RX is the radius of the X-ray corona and t is the duration of the obscuration event (i.e. 32 days). We adopt a fiducial radius of 10 Rg for the X-ray corona, where the gravitational radius Rg = GM•/c2, with G the gravitational constant, c the speed of light, and M• = 2.98 × 10⁷M⊙ the black hole mass (Vestergaard & Peterson 2006). These yield d = 8.8 × 1013 cm and vt = 320km s-1 for the obscurer. The obscurer density nH ~ NH/D, where NH = 2.3 × 1023cm-2 (Table 1) and D is the length of the obscurer in our line of sight. The length D is equal to the above transverse size d assuming an obscuring cloud with a spherical geometry. This gives a nH of about 2.6 × 109 cm-3, which is a typical broad-line region (BLR) density (e.g. Baldwin et al. 1995). Finally, from the definition of the ionisation parameter ξ, we have  , where the ionising luminosity L over 1–1000 Ryd is about 1.1 × 1044 erg s-1 and ξ = 101.84 erg cm s-1 from our modelling. This yields a distance r ~ 10 light days from the black hole. For comparison, the radius of the BLR in NGC 3783 from reverberation mapping (Peterson et al. 2004) ranges from about 1.4 (He ii) to 10.2 (Hβ) light days. The radius of the IR torus is 250–357 light days (Beckert et al. 2008). Therefore, the obscurer is likely located in the outer BLR.
Previous studies of NGC 3783 have found an outflowing HC through the detection of a narrow Fe xxv Heα absorption line (e.g. Yaqoob et al. 2005). From our joint analysis of the stacked archival HETGS and EPIC-pn data, we find the component responsible for this narrow Fe xxv absorption line has log ξ = 3.0 ± 0.1 and NH = 1.4 ± 0.1 × 1022cm-2, with v = − 450 ± 50km s-1 and σv = 100km s-1. However, in the 2016 obscured data a more massive (2.3 × 1023cm-2) and more ionised HC is present, which is also faster and broader than the archival HC (Table 1). Absorption by the Fe xxvi Lyα in the HC causes the disappearance of the Fe Kβ emission line (Fig. 4, middle panel). In both archival and obscured observations, the line energy and flux of the Fe Kα line remain unchanged within errors (about ± 20 eV in line energy and ± 10% in flux). Therefore, according to the theoretical Fe K line calculations (Palmeri et al. 2003; Kallman et al. 2004), a similar Fe Kβ emission line would be expected in 2016, hence its disappearance cannot be due to a change in the ionisation state of the line-emitting region. The appearance of the new HC in 2016 data of NGC 3783 is likely associated with the obscurer. The increase in ξ between the two 2016 observations (Table 1) matches the observed change in the ionising luminosity L of the source between the two observations, varying from 1.0 to 1.2 × 1044 erg s-1. This enables us to put limits on distance r of the HC from its recombination timescale trec. From our photoionisation modelling, nH × trec for Fe xxvi is derived. Since trec has to be shorter than the spacing between the two observations (9.7 days), this can be used to put constraints on nH and hence r. We find the HC has nH> 2.3 × 105 cm-3 and r< 120 light days. Thus, it may coexist spatially with the obscurer at the outer BLR. Both the obscurer and the HC have comparable velocities (Table 1).
The eclipsing obscurer in NGC 3783 is outflowing because it produces blue-shifted and broad absorption lines. Since the obscurer is found to be inhomogeneous and clumpy, and its location matches the BLR, it is consistent with being in the base of a radiatively driven wind at the BLR (Murray et al. 1995; Proga & Kallman 2004; Proga et al. 2014). Similar X-ray eclipses found in NGC 1365 and Mrk 766 have also been attributed to the passage of BLR clouds in our line of sight to the X-ray source (Risaliti et al. 2007, 2011). Similar to that found in NGC 3783, an association between obscuration and a HC has also been found for the luminous quasar PDS 456 (Reeves et al. 2009; Nardini et al. 2015), where a partially covering Compton-thick absorber appears together with a highly ionised relativistic disk wind. Interestingly, the obscuring wind and the HC in this quasar are a more massive and faster version of the wind in the less luminous Seyfert-1 NGC 3783. We note that although Compton-thick obscuration is associated with outflows in PDS 456, not all Compton-thick obscurations in AGN may necessarily be related to outflows in general. Determining the origin of X-ray obscuration in nearby type-I galaxies provides key observational evidence for understanding the launching mechanisms of outflows in more powerful quasars at higher redshifts, which, due to their faint signal, cannot be studied with current X-ray observatories. Such winds, with significantly high outflow velocities and mass outflow rates, can play an important role in AGN feedback. The ToO multiwavelength spectroscopy of X-ray eclipses, like that performed here on NGC 3783 using XMM-Newton, NuSTAR, and HST COS, is an effective way to determine the physical link between the accretion disk, BLR, and outflows in AGN.
Acknowledgments
This work is based on observations obtained with XMM-Newton, an ESA science mission with instruments and contributions directly funded by ESA Member States and the USA (NASA). This research has made use of data obtained with the NuSTAR mission, a project led by the California Institute of Technology (Caltech), managed by the Jet Propulsion Laboratory (JPL) and funded by NASA. This work made use of data supplied by the UK Swift Science Data Centre at the University of Leicester. We thank the Swift team for monitoring our AGN sample, and the XMM-Newton, NuSTAR, and HST teams for scheduling our ToO triggered observations. SRON is supported financially by NWO, the Netherlands Organization for Scientific Research. This work was supported by NASA through a grant for HST program number 14481 from the Space Telescope Science Institute, which is operated by the Association of Universities for Research in Astronomy, Incorporated, under NASA contract NAS5-26555. The research at the Technion is supported by the I-CORE program of the Planning and Budgeting Committee (grant number 1937/12). E.B. acknowledges funding from the European Union’s Horizon 2020 research and innovation programme under the Marie Sklodowska-Curie grant agreement No. 655324. S.B. acknowledges financial support from the Italian Space Agency under grant ASI-INAF I/037/12/0, and from the European Union Seventh Framework Programme (FP7/2007-2013) under grant agreement No. 31278. E.C. is partially supported by the NWO-Vidi grant number 633.042.525. L.D.G. acknowledges support from the Swiss National Science Foundation. B.D.M. acknowledges support from the European Union’s Horizon 2020 research and innovation programme under the Marie Skłodowska-Curie grant agreement No. 665778 via the Polish National Science Center grant Polonez UMO-2016/21/P/ST9/04025. C.P. acknowledges support from ERC Advanced Grant Feedback 340442. G.P. acknowledges support from the Bundesministerium für Wirtschaft und Technologie/Deutsches Zentrum für Luft- und Raumfahrt (BMWI/DLR, FKZ 50 OR 1604) and the Max Planck Society. We thank M. Bentz for providing us with the host galaxy flux in NGC 3783, and M. Giustini for useful discussions. We thank the anonymous referee for the useful comments.
References
- Baldwin, J., Ferland, G., Korista, K., & Verner, D. 1995, ApJ, 455, L119 [NASA ADS] [CrossRef] [Google Scholar]
- Beckert, T., Driebe, T., Hönig, S. F., & Weigelt, G. 2008, A&A, 486, L17 [NASA ADS] [CrossRef] [EDP Sciences] [Google Scholar]
- Behar, E., Rasmussen, A. P., Blustin, A. J., et al. 2003, ApJ, 598, 232 [NASA ADS] [CrossRef] [Google Scholar]
- Bentz, M. C., Denney, K. D., Grier, C. J., et al. 2013, ApJ, 767, 149 [NASA ADS] [CrossRef] [Google Scholar]
- Beuchert, T., Markowitz, A. G., Dauser, T., et al. 2017, A&A, 603, A50 [NASA ADS] [CrossRef] [EDP Sciences] [Google Scholar]
- Blustin, A. J., Branduardi-Raymont, G., Behar, E., et al. 2002, A&A, 392, 453 [NASA ADS] [CrossRef] [EDP Sciences] [Google Scholar]
- Blustin, A. J., Page, M. J., Fuerst, S. V., Branduardi-Raymont, G., & Ashton, C. E. 2005, A&A, 431, 111 [NASA ADS] [CrossRef] [EDP Sciences] [Google Scholar]
- Crenshaw, D. M., Kraemer, S. B., Boggess, A., et al. 1999, ApJ, 516, 750 [NASA ADS] [CrossRef] [Google Scholar]
- De Rosa, A., Piro, L., Fiore, F., et al. 2002, A&A, 387, 838 [NASA ADS] [CrossRef] [EDP Sciences] [Google Scholar]
- Ebrero, J., Kriss, G. A., Kaastra, J. S., & Ely, J. C. 2016, A&A, 586, A72 [NASA ADS] [CrossRef] [EDP Sciences] [Google Scholar]
- Fabian, A. C. 2012, ARA&A, 50, 455 [NASA ADS] [CrossRef] [Google Scholar]
- Ferland, G. J., Porter, R. L., van Hoof, P. A. M., et al. 2013, Rev. Mexicana Astron. Astrofis., 49, 137 [Google Scholar]
- Ferrarese, L., & Merritt, D. 2000, ApJ, 539, L9 [NASA ADS] [CrossRef] [Google Scholar]
- Gabel, J. R., Kraemer, S. B., Crenshaw, D. M., et al. 2005, ApJ, 631, 741 [NASA ADS] [CrossRef] [Google Scholar]
- Goosmann, R. W., Holczer, T., Mouchet, M., et al. 2016, A&A, 589, A76 [NASA ADS] [CrossRef] [EDP Sciences] [Google Scholar]
- Holczer, T., Behar, E., & Kaspi, S. 2007, ApJ, 663, 799 [NASA ADS] [CrossRef] [Google Scholar]
- Huenemoerder, D. P., Mitschang, A., Dewey, D., et al. 2011, AJ, 141, 129 [NASA ADS] [CrossRef] [Google Scholar]
- Kaastra, J. S., & Bleeker, J. A. M. 2016, A&A, 587, A151 [NASA ADS] [CrossRef] [EDP Sciences] [Google Scholar]
- Kaastra, J. S., Mewe, R., & Nieuwenhuijzen, H. 1996, in UV and X-ray Spectroscopy of Astrophysical and Laboratory Plasmas (Tokyo: Universal Academy Press), 411 [Google Scholar]
- Kaastra, J. S., Detmers, R. G., Mehdipour, M., et al. 2012, A&A, 539, A117 [NASA ADS] [CrossRef] [EDP Sciences] [Google Scholar]
- Kaastra, J. S., Kriss, G. A., Cappi, M., et al. 2014, Science, 345, 64 [NASA ADS] [CrossRef] [Google Scholar]
- Kallman, T. R., Palmeri, P., Bautista, M. A., Mendoza, C., & Krolik, J. H. 2004, ApJS, 155, 675 [NASA ADS] [CrossRef] [Google Scholar]
- Kaspi, S., Brandt, W. N., George, I. M., et al. 2002, ApJ, 574, 643 [NASA ADS] [CrossRef] [Google Scholar]
- Kinney, A. L., Calzetti, D., Bohlin, R. C., et al. 1996, ApJ, 467, 38 [NASA ADS] [CrossRef] [Google Scholar]
- Krolik, J. H., McKee, C. F., & Tarter, C. B. 1981, ApJ, 249, 422 [NASA ADS] [CrossRef] [Google Scholar]
- Lodders, K., Palme, H., & Gail, H.-P. 2009, Landolt Börnstein, 44 [Google Scholar]
- Longinotti, A. L., Krongold, Y., Kriss, G. A., et al. 2013, ApJ, 766, 104 [NASA ADS] [CrossRef] [Google Scholar]
- Markowitz, A. G., Krumpe, M., & Nikutta, R. 2014, MNRAS, 439, 1403 [NASA ADS] [CrossRef] [Google Scholar]
- Matzeu, G. A., Reeves, J. N., Nardini, E., et al. 2016, MNRAS, 458, 1311 [NASA ADS] [CrossRef] [Google Scholar]
- Mehdipour, M., Kaastra, J. S., Kriss, G. A., et al. 2015, A&A, 575, A22 [NASA ADS] [CrossRef] [EDP Sciences] [Google Scholar]
- Mehdipour, M., Kaastra, J. S., Kriss, G. A., et al. 2016a, A&A, 588, A139 [NASA ADS] [CrossRef] [EDP Sciences] [Google Scholar]
- Mehdipour, M., Kaastra, J. S., & Kallman, T. 2016b, A&A, 596, A65 [NASA ADS] [CrossRef] [EDP Sciences] [Google Scholar]
- Murphy, E. M., Lockman, F. J., Laor, A., & Elvis, M. 1996, ApJS, 105, 369 [NASA ADS] [CrossRef] [Google Scholar]
- Murray, N., Chiang, J., Grossman, S. A., & Voit, G. M. 1995, ApJ, 451, 498 [NASA ADS] [CrossRef] [Google Scholar]
- Nardini, E., Reeves, J. N., Gofford, J., et al. 2015, Science, 347, 860 [Google Scholar]
- Palmeri, P., Mendoza, C., Kallman, T. R., Bautista, M. A., & Meléndez, M. 2003, A&A, 410, 359 [NASA ADS] [CrossRef] [EDP Sciences] [Google Scholar]
- Parker, M. L., Alston, W. N., Buisson, D. J. K., et al. 2017, MNRAS, 469, 1553 [NASA ADS] [CrossRef] [Google Scholar]
- Peterson, B. M., Ferrarese, L., Gilbert, K. M., et al. 2004, ApJ, 613, 682 [NASA ADS] [CrossRef] [Google Scholar]
- Proga, D., & Kallman, T. R. 2004, ApJ, 616, 688 [Google Scholar]
- Proga, D., Jiang, Y.-F., Davis, S. W., Stone, J. M., & Smith, D. 2014, ApJ, 780, 51 [NASA ADS] [CrossRef] [Google Scholar]
- Reeves, J. N., O’Brien, P. T., Braito, V., et al. 2009, ApJ, 701, 493 [NASA ADS] [CrossRef] [Google Scholar]
- Risaliti, G., Elvis, M., Fabbiano, G., et al. 2007, ApJ, 659, L111 [NASA ADS] [CrossRef] [Google Scholar]
- Risaliti, G., Nardini, E., Salvati, M., et al. 2011, MNRAS, 410, 1027 [NASA ADS] [CrossRef] [Google Scholar]
- Rivers, E., Risaliti, G., Walton, D. J., et al. 2015, ApJ, 804, 107 [NASA ADS] [CrossRef] [Google Scholar]
- Schlafly, E. F., & Finkbeiner, D. P. 2011, ApJ, 737, 103 [NASA ADS] [CrossRef] [Google Scholar]
- Scott, A. E., Brandt, W. N., Behar, E., et al. 2014, ApJ, 797, 105 [NASA ADS] [CrossRef] [Google Scholar]
- Theureau, G., Bottinelli, L., Coudreau-Durand, N., et al. 1998, A&AS, 130, 333 [Google Scholar]
- Vestergaard, M., & Peterson, B. M. 2006, ApJ, 641, 689 [NASA ADS] [CrossRef] [Google Scholar]
- Yaqoob, T., Reeves, J. N., Markowitz, A., Serlemitsos, P. J., & Padmanabhan, U. 2005, ApJ, 627, 156 [NASA ADS] [CrossRef] [Google Scholar]
Appendix A: Observation logs
Log of the triggered XMM-Newton, NuSTAR, and HST COS ToO observations of NGC 3783 using our weekly Swift monitoring in 2016.
All Tables
Best-fit parameters of the two obscurer components and the new high-ionisation component (HC) for Obs. 1 (11 December 2016) and Obs. 2 (21 December 2016).
Log of the triggered XMM-Newton, NuSTAR, and HST COS ToO observations of NGC 3783 using our weekly Swift monitoring in 2016.
All Figures
|
Fig. 1 Swift light curve of NGC 3783 from 17 May 2016 to 21 January 2017. The horizontal dotted lines in the two upper panels show the all-time average Swift flux levels. The dashed black line in the bottom panel indicates the average quiescent hardness ratio (HR) from unobscured data. The dashed line in red is the HR limit for triggering, above which significant obscuration was predicted according to our simulations. The first and second XMM-Newton observations are indicated by vertical dotted lines. |
| In the text | |
|
Fig. 2 NGC 3783 spectra from XMM-Newton EPIC-pn and NuSTAR (top panel), and XMM-Newton RGS (bottom panel). The displayed energy range for EPIC-pn is 0.3–10 keV and for NuSTAR 10–80 keV. |
| In the text | |
|
Fig. 3 NGC 3783 HST COS and STIS spectra near the C iv line. The line transmission model for the new broad C iv absorption component in 2016 is shown in the top panel. The displayed spectra are continuum subtracted and then offset vertically by 2.5 × 10⁻¹⁴erg cm-2 s-1 Å-1 for each epoch so that the weaker changes in the absorption are more visible. Narrow absorption lines in the blue wing are interstellar Si iiλ1526 and C ivλ1548,1551. |
| In the text | |
|
Fig. 4 Top panel: NGC 3783 EPIC-pn data fit residuals without absorption by a high-ionisation component (HC), showing new Fe xxv and Fe xxvi absorption lines in the 2016 obscured epoch. Middle panel: line transmission of the blue-shifted HC Fe xxv and Fe xxvi absorption lines (solid lines), shown with respect to the Fe Kα and Fe Kβ emission lines and the continuum unaffected by the HC line absorption (dotted lines). Bottom panel: EPIC-pn data and their best-fit model (dotted lines). |
| In the text | |
|
Fig. 5 Continuum and line transmission of all the absorption components in our line of sight towards the nucleus of NGC 3783. The solid lines correspond to Obs. 1, and the dotted lines to Obs. 2. |
| In the text | |
|
Fig. 6 Top panel: best-fit model to each dataset of NGC 3783, and its corresponding SED model. The displayed X-ray data include absorption by the Galaxy, the WA, and the obscurer. Bottom panel: residuals of the best-fit model. |
| In the text | |
Current usage metrics show cumulative count of Article Views (full-text article views including HTML views, PDF and ePub downloads, according to the available data) and Abstracts Views on Vision4Press platform.
Data correspond to usage on the plateform after 2015. The current usage metrics is available 48-96 hours after online publication and is updated daily on week days.
Initial download of the metrics may take a while.