Fig. 1
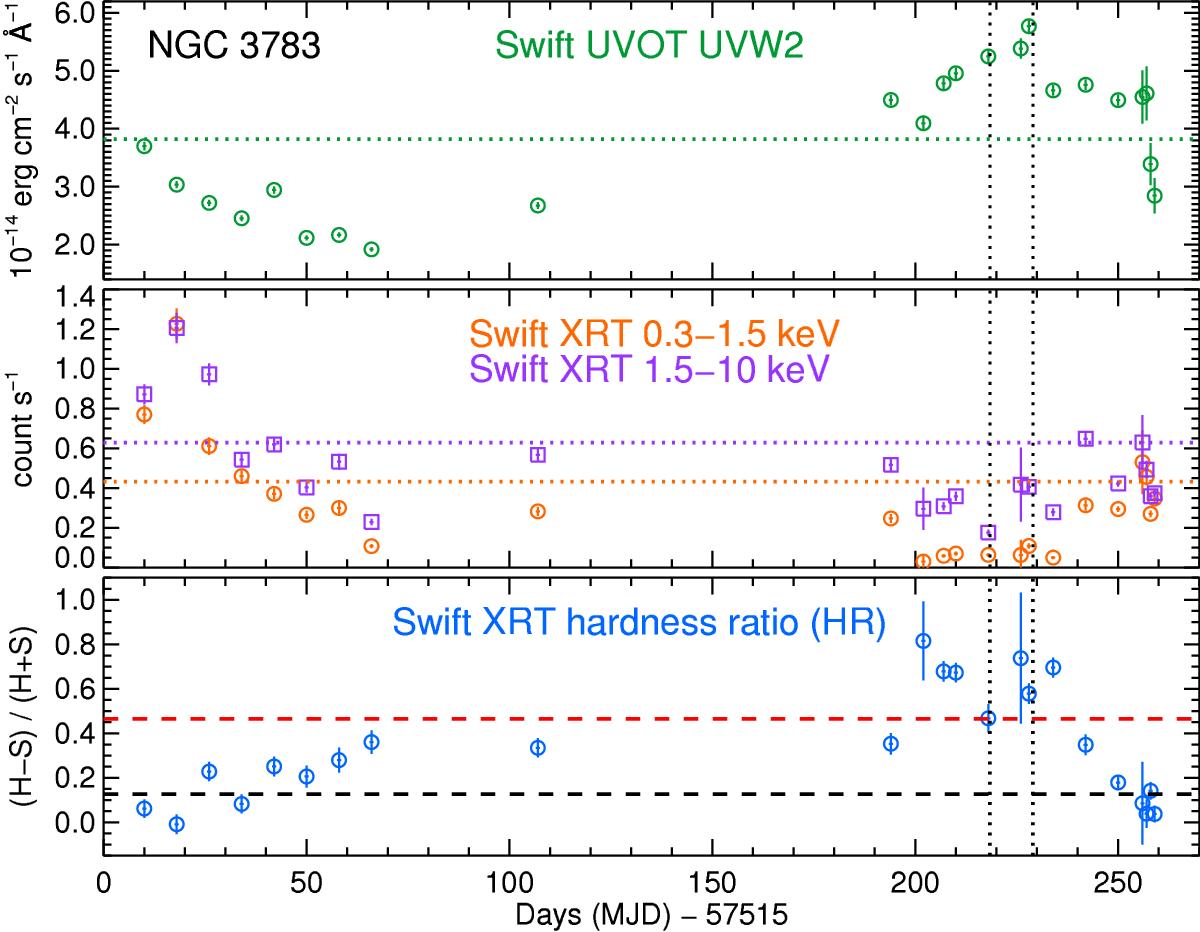
Swift light curve of NGC 3783 from 17 May 2016 to 21 January 2017. The horizontal dotted lines in the two upper panels show the all-time average Swift flux levels. The dashed black line in the bottom panel indicates the average quiescent hardness ratio (HR) from unobscured data. The dashed line in red is the HR limit for triggering, above which significant obscuration was predicted according to our simulations. The first and second XMM-Newton observations are indicated by vertical dotted lines.
Current usage metrics show cumulative count of Article Views (full-text article views including HTML views, PDF and ePub downloads, according to the available data) and Abstracts Views on Vision4Press platform.
Data correspond to usage on the plateform after 2015. The current usage metrics is available 48-96 hours after online publication and is updated daily on week days.
Initial download of the metrics may take a while.