Fig. 3
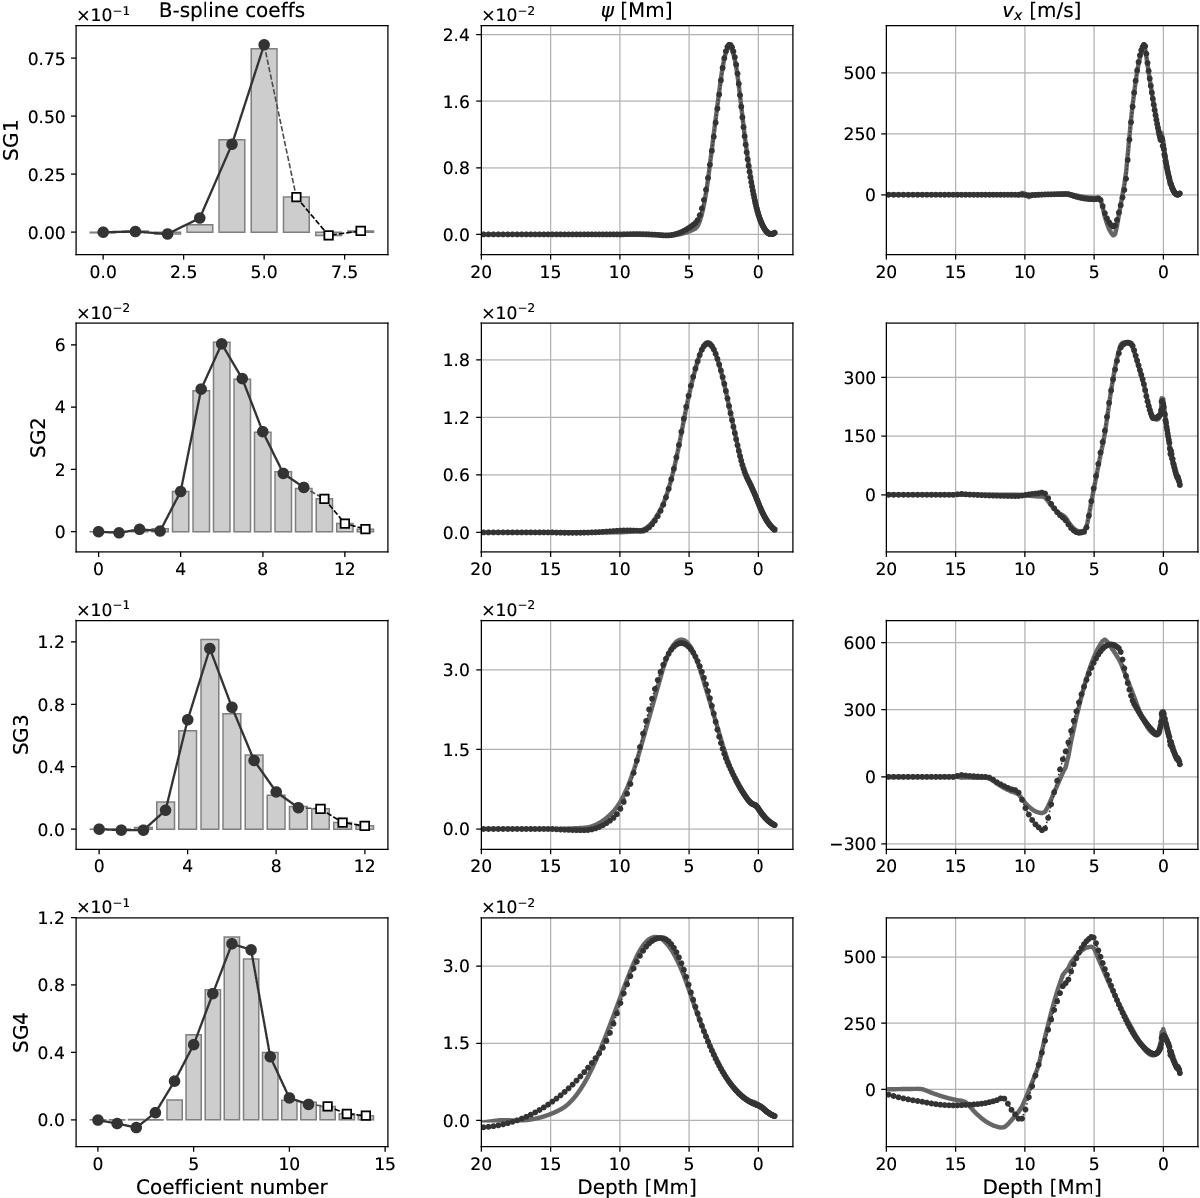
True and inverted profiles for the four supergranule Gaussian profiles from Table 1. Each row corresponds to one model, where the left panel represents the B-spline coefficients, the middle panel shows the vertical profile of the stream function, and the rightmost panel depicts the vertical profile of the horizontal component of the flow velocity. The profile of vertical flow is not plotted, but is similar to the stream function. In the leftmost panel for each row, bars represent B-spline coefficients for the true stream function; white squares represent spline coefficients above the surface, which are clamped to the value in the true model; and black circles represent coefficients for the inverted solution. In the middle and right panels of each row, gray solid lines represents vertical profiles of the true models and black circles denote the profile for the inversion result.
Current usage metrics show cumulative count of Article Views (full-text article views including HTML views, PDF and ePub downloads, according to the available data) and Abstracts Views on Vision4Press platform.
Data correspond to usage on the plateform after 2015. The current usage metrics is available 48-96 hours after online publication and is updated daily on week days.
Initial download of the metrics may take a while.