Fig. 1
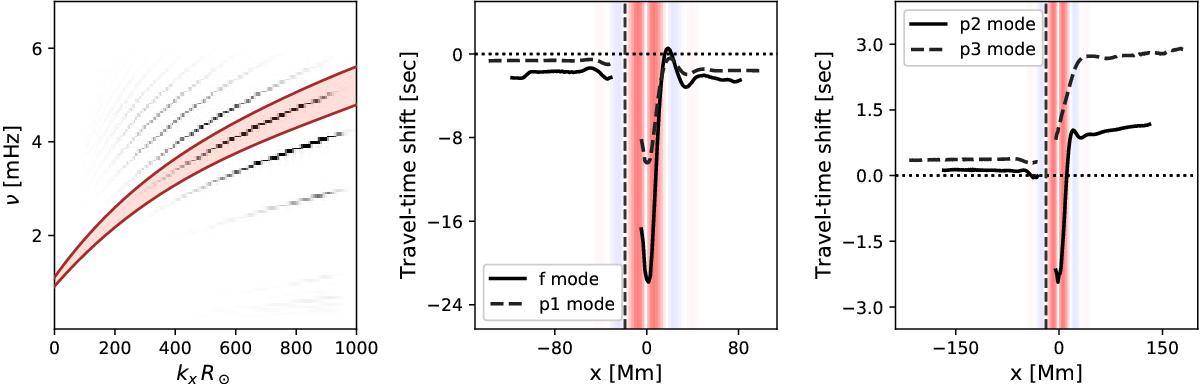
Left panel: wave spectrum overlaid with the function used to filter waves corresponding to the radial order p2. Middle and right panels: travel-time shifts between waves in the starting and true flow models for supergranule SG2, computed at all receivers for different radial orders. The horizontal location of the source is indicated by the dashed vertical line. The horizontal flow field of the supergranule is indicated by the colored patch in the background, where red indicates outflows away from the cell center and blue indicates inflows toward the cell center.
Current usage metrics show cumulative count of Article Views (full-text article views including HTML views, PDF and ePub downloads, according to the available data) and Abstracts Views on Vision4Press platform.
Data correspond to usage on the plateform after 2015. The current usage metrics is available 48-96 hours after online publication and is updated daily on week days.
Initial download of the metrics may take a while.