Fig. 9
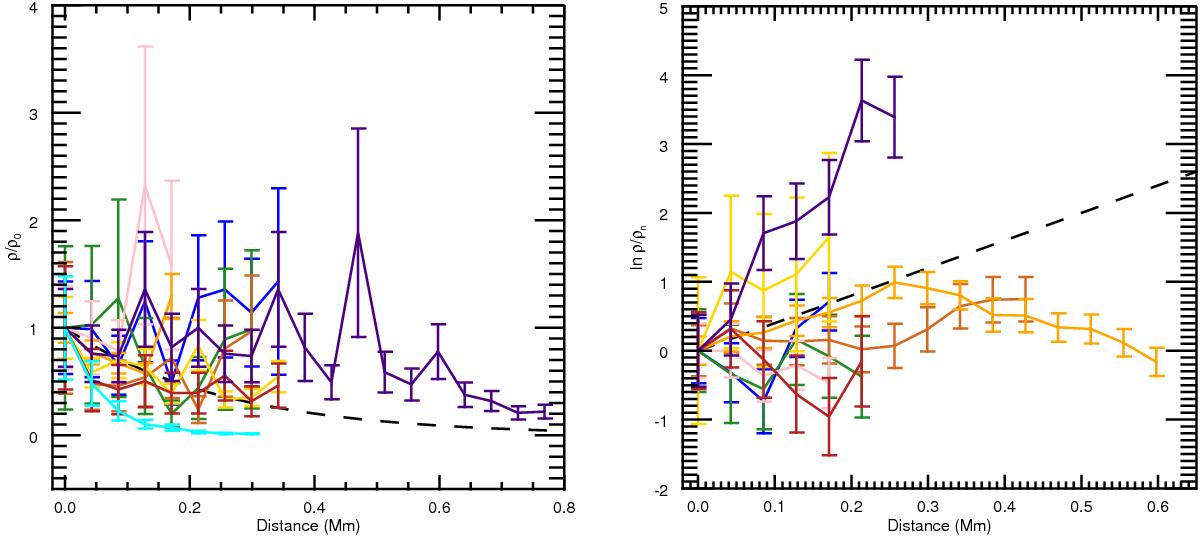
Magneto-seismological inversions for the relative change in density along the IN fibrils. The profiles are separated whether the wave was measured to be propagating away from the apparent endpoint of the fibril (left) or towards it (right). The black dashed line is the expected relative change in density for a hydrostatic atmosphere with scale height 250 km.
Current usage metrics show cumulative count of Article Views (full-text article views including HTML views, PDF and ePub downloads, according to the available data) and Abstracts Views on Vision4Press platform.
Data correspond to usage on the plateform after 2015. The current usage metrics is available 48-96 hours after online publication and is updated daily on week days.
Initial download of the metrics may take a while.