Fig. 7
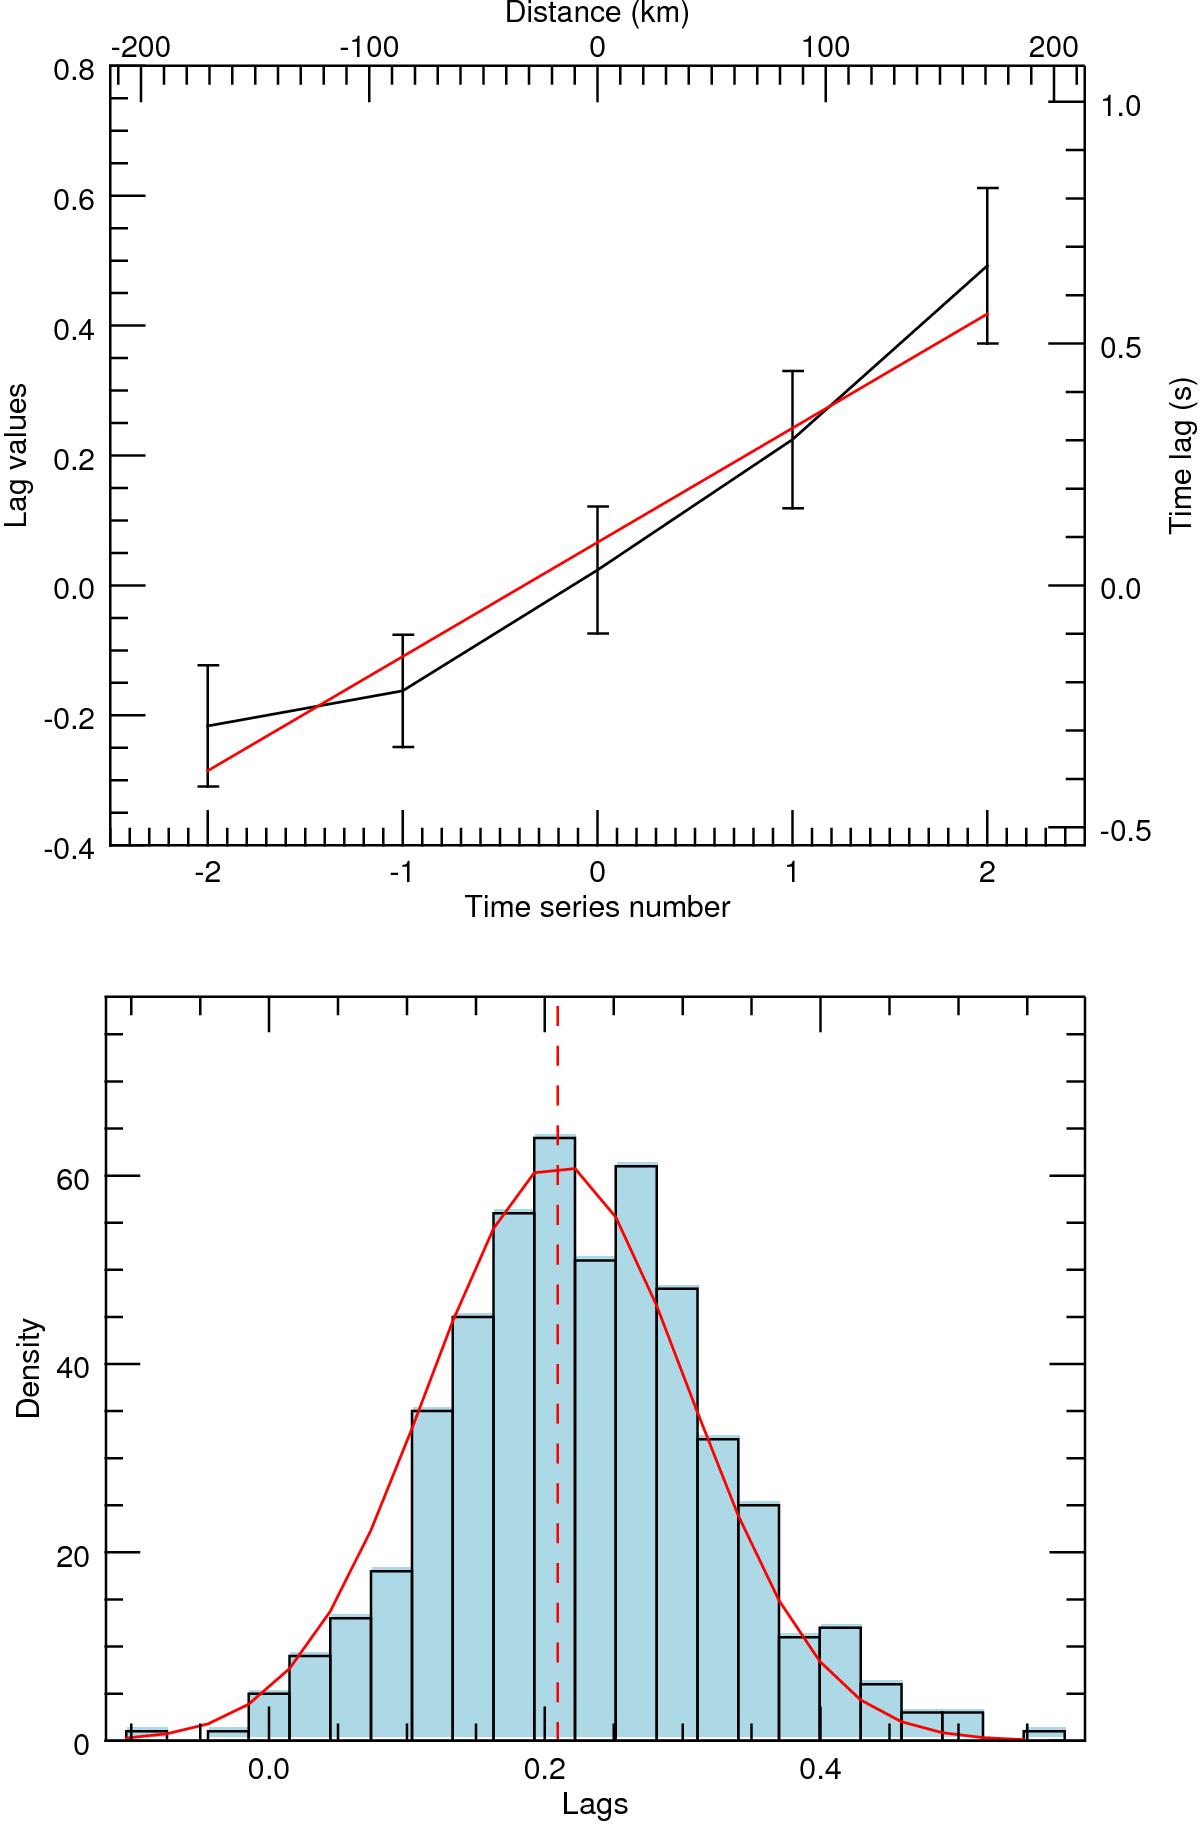
Propagation speed measurement. Top panel: lag values as a function of the time-series position. The zero time-series number corresponds to the middle time-series in the range. A linear fit is shown by the red line, the gradient of which determines the propagation speed. Bottom panel: typical distribution of time lags between two time-series from the re-sampling technique. The red line is a fitted Gaussian with the mean shown by the dashed red line. The mean and sigma values of the Gaussian are used as the lag and uncertainty on the lag respectively.
Current usage metrics show cumulative count of Article Views (full-text article views including HTML views, PDF and ePub downloads, according to the available data) and Abstracts Views on Vision4Press platform.
Data correspond to usage on the plateform after 2015. The current usage metrics is available 48-96 hours after online publication and is updated daily on week days.
Initial download of the metrics may take a while.