Fig. 6
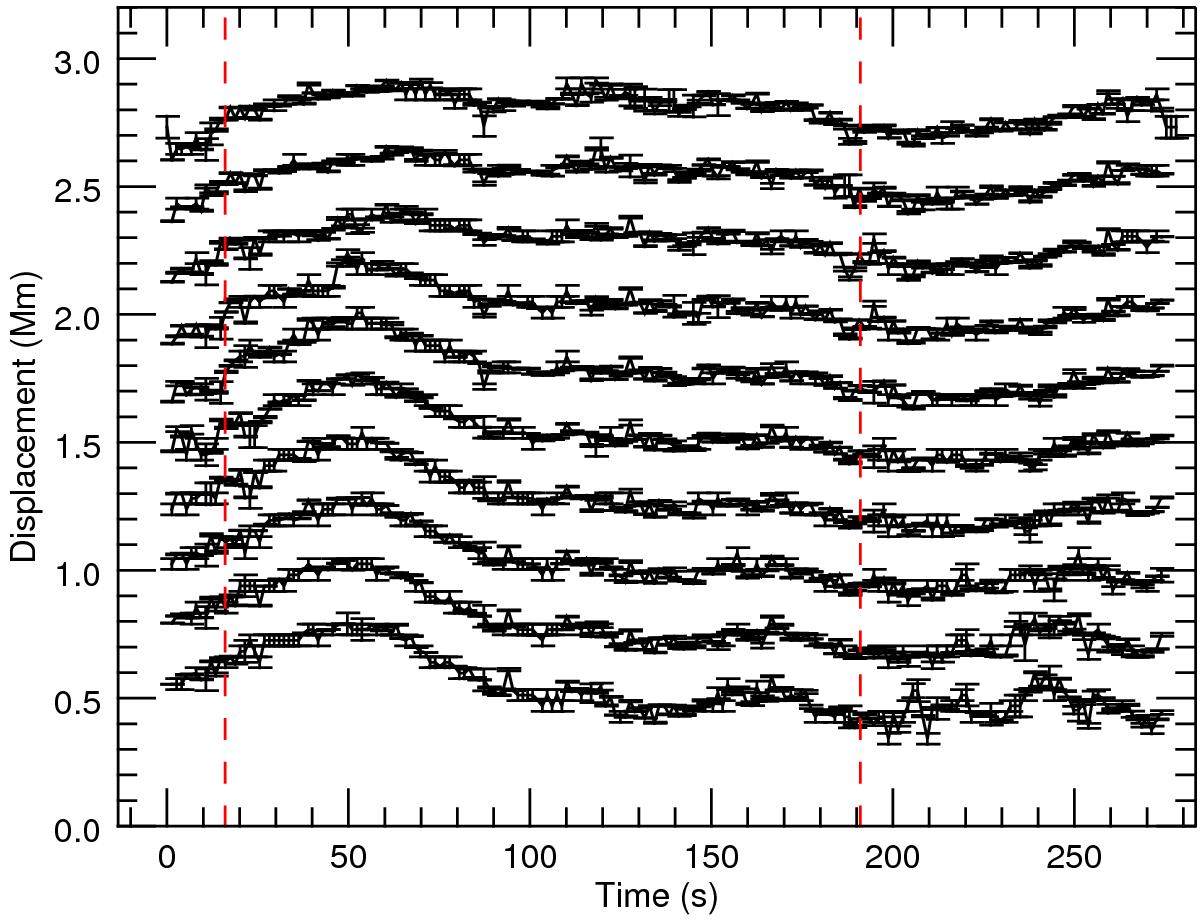
Set of time-series taken from a single IN fibril. Each time-series corresponds to a measurement of the central location of the fibril from a time-distance diagram. In this example, the time-series are measured at separations of 85 km taken along an IN fibril feature. The red dotted lines shows the time interval used for cross correlation.
Current usage metrics show cumulative count of Article Views (full-text article views including HTML views, PDF and ePub downloads, according to the available data) and Abstracts Views on Vision4Press platform.
Data correspond to usage on the plateform after 2015. The current usage metrics is available 48-96 hours after online publication and is updated daily on week days.
Initial download of the metrics may take a while.