Fig. 5
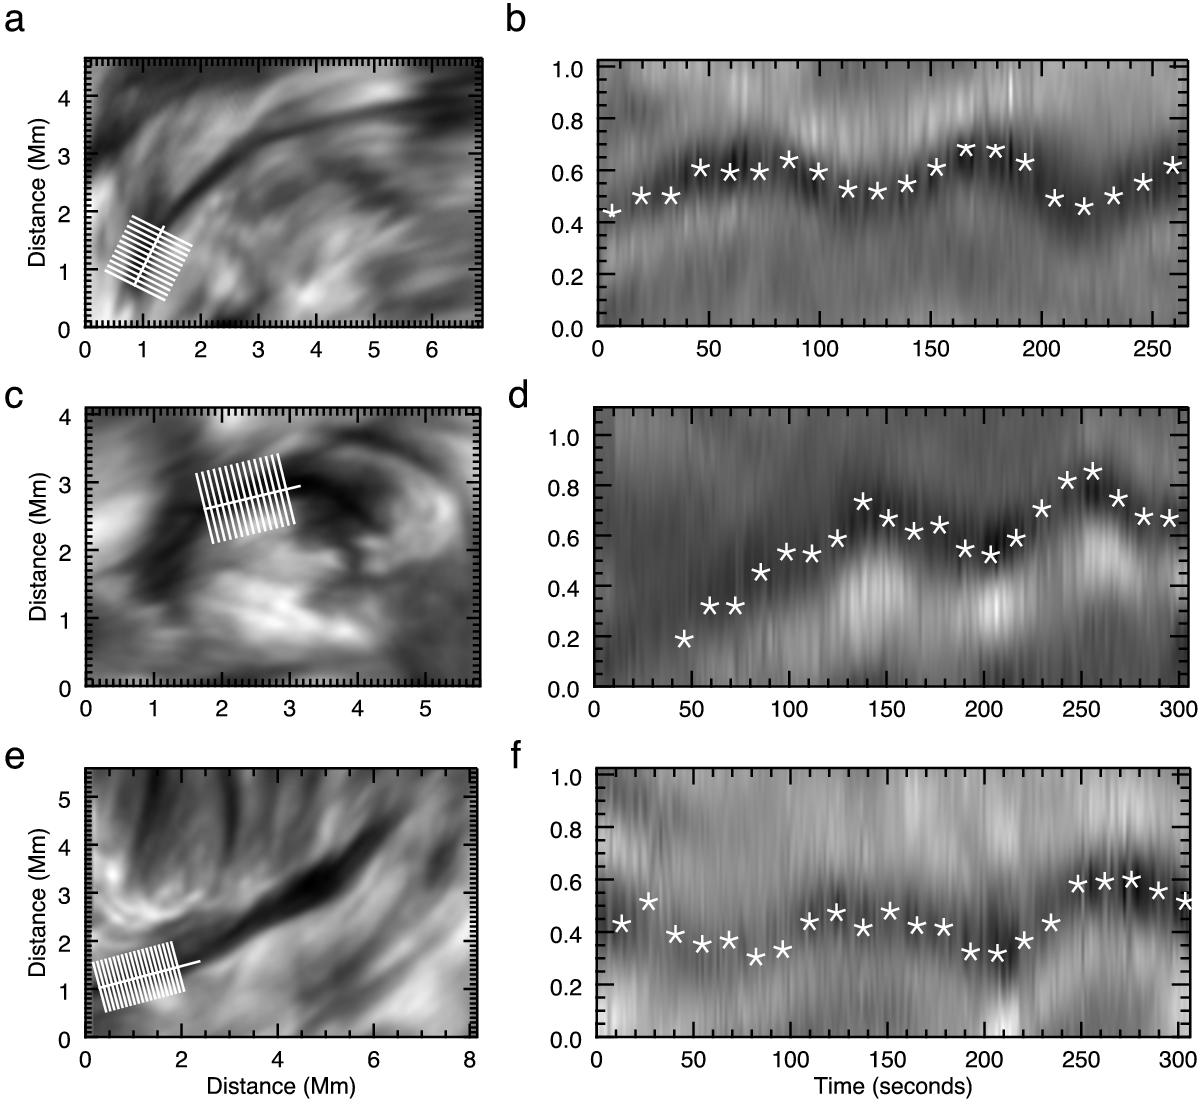
Examples of IN fibrils are shown in the left-hand column. White lines are over-plotted to show locations of cross-cuts taken along the structure. The longitudinal line serves as a guide line along the fibril axis. Right-hand panels: examples of time-distance diagrams from the IN fibrils, revealing the transverse displacements of the IN fibril. The white stars highlight where the measured central locations of the IN fibrils axis are from the fitting routine. Every 10th point is plotted for clarity.
Current usage metrics show cumulative count of Article Views (full-text article views including HTML views, PDF and ePub downloads, according to the available data) and Abstracts Views on Vision4Press platform.
Data correspond to usage on the plateform after 2015. The current usage metrics is available 48-96 hours after online publication and is updated daily on week days.
Initial download of the metrics may take a while.