Fig. 4
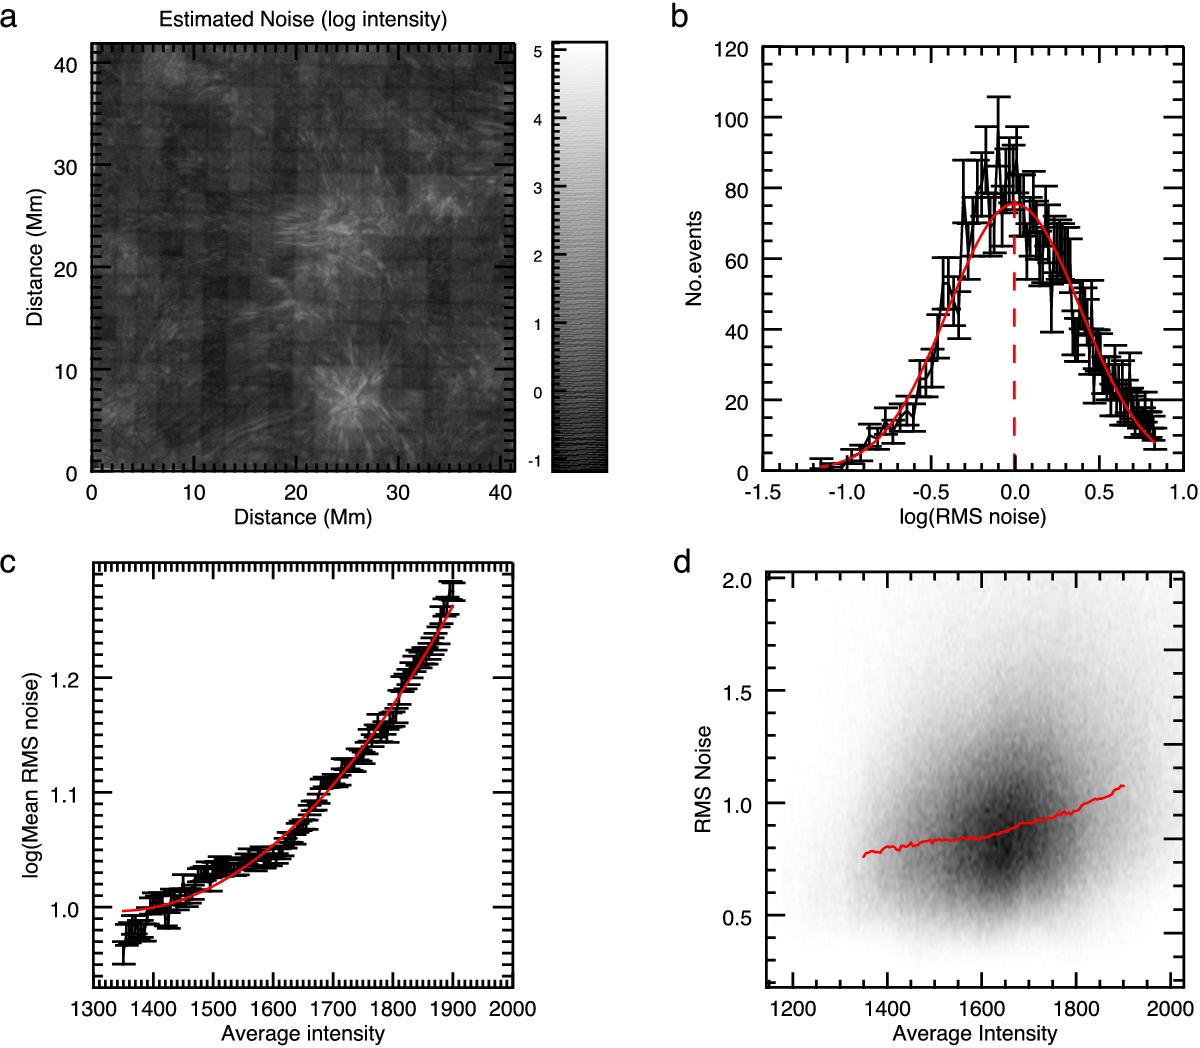
Noise estimation process. The rms residual intensity or noise (natural log units) is obtained across the FOV panel a, which has the joint probability distribution shown in panel d when compared to average intensity. The bin widths used in panel d are 0.01 units in the rms noise and five units in the intensity. In panel b, an example of the 1D histograms of the rms noise estimate for the intensity bin 400−405 is shown. The over-plotted red curve in panel b is a fitted Gaussian and the vertical red dotted line signifies the location of the mean. Panel c demonstrates the relationship between average intensity and the mean value of the log rms noise estimate. The polynomial fit to the mean values is over-plotted in red, the equation of this curve (Eq. (1)) will serve as the estimate of noise. The same data points are over-plotted on the JPDF panel d as a red line.
Current usage metrics show cumulative count of Article Views (full-text article views including HTML views, PDF and ePub downloads, according to the available data) and Abstracts Views on Vision4Press platform.
Data correspond to usage on the plateform after 2015. The current usage metrics is available 48-96 hours after online publication and is updated daily on week days.
Initial download of the metrics may take a while.