Fig. 3
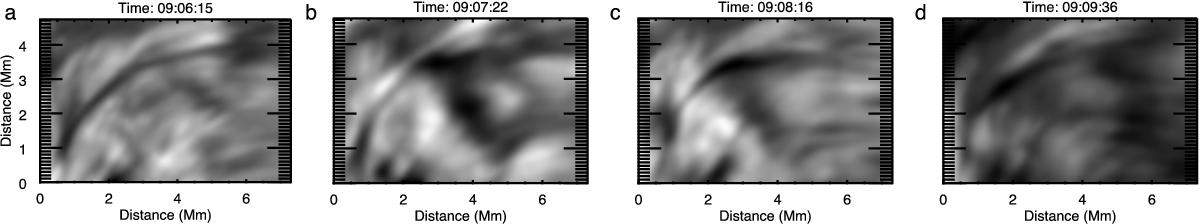
Panel a: one of IN fibrils in the data set, which can be seen at (8, 20) Mm in the line core image in Fig. 1. Panel b: a parcel of plasma is seen at the upper end of the fibril, significantly broadening the apparent width of the feature. The dark clump can be seen to move along the apparent axis of the feature in panels c and d (from upper right to lower left).
Current usage metrics show cumulative count of Article Views (full-text article views including HTML views, PDF and ePub downloads, according to the available data) and Abstracts Views on Vision4Press platform.
Data correspond to usage on the plateform after 2015. The current usage metrics is available 48-96 hours after online publication and is updated daily on week days.
Initial download of the metrics may take a while.