Fig. 1
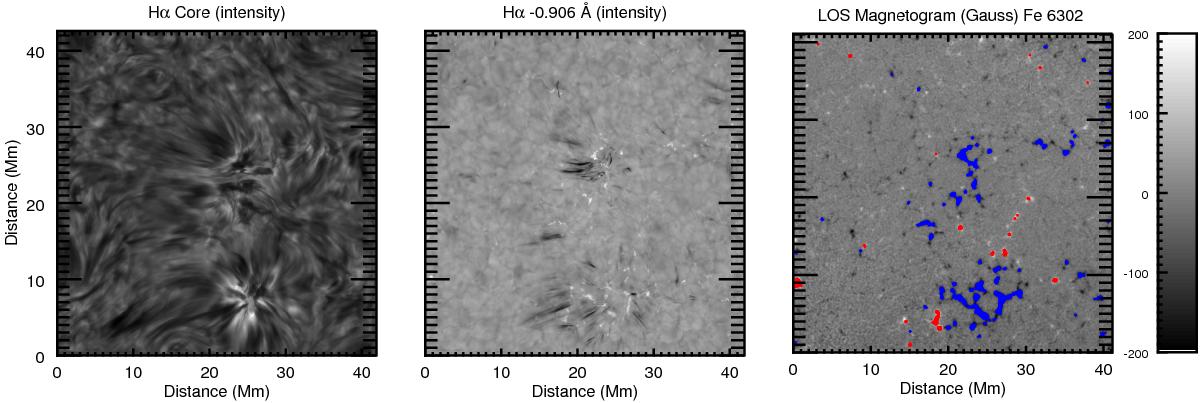
Hα line core and blue wing images are shown in the left and centre panels respectively. The two major magnetic flux concentrations that form part of the network and associated chromospheric rosettes are evident. Right hand panel: photospheric magnetogram. The levels have been clipped to B ~ ± 200 G to reveal some of the weaker fields in the IN. Contours highlight absolute magnetic field strengths greater than the cut-off, red showing positive flux and blue negative.
Current usage metrics show cumulative count of Article Views (full-text article views including HTML views, PDF and ePub downloads, according to the available data) and Abstracts Views on Vision4Press platform.
Data correspond to usage on the plateform after 2015. The current usage metrics is available 48-96 hours after online publication and is updated daily on week days.
Initial download of the metrics may take a while.