Free Access
Fig. C.1
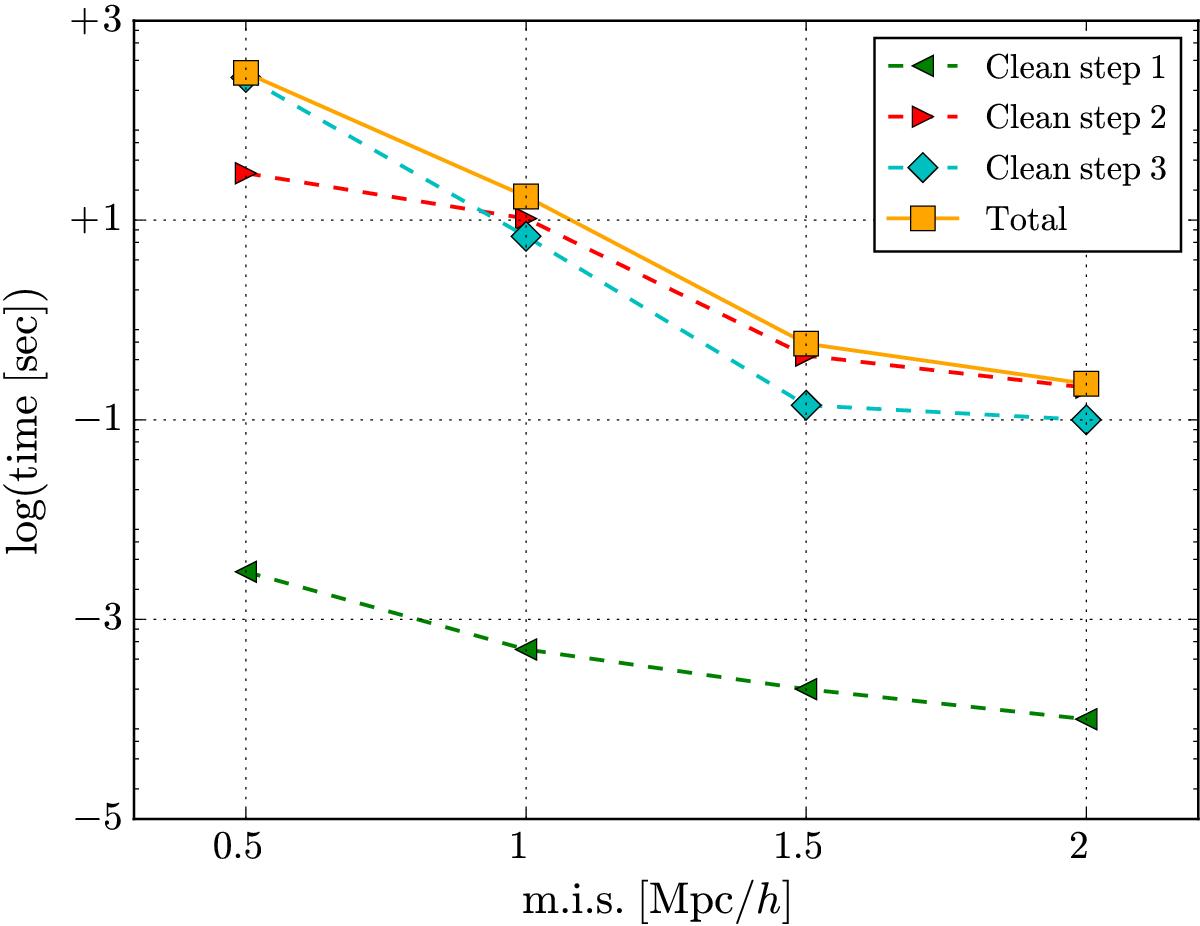
Time performances of the cleaning algorithm as a function of the mean inter-particle separation. The orange dots show the total amount of time spent by the code, while the other symbols refer to each step of the cleaning method, as indicated by the labels.
Current usage metrics show cumulative count of Article Views (full-text article views including HTML views, PDF and ePub downloads, according to the available data) and Abstracts Views on Vision4Press platform.
Data correspond to usage on the plateform after 2015. The current usage metrics is available 48-96 hours after online publication and is updated daily on week days.
Initial download of the metrics may take a while.