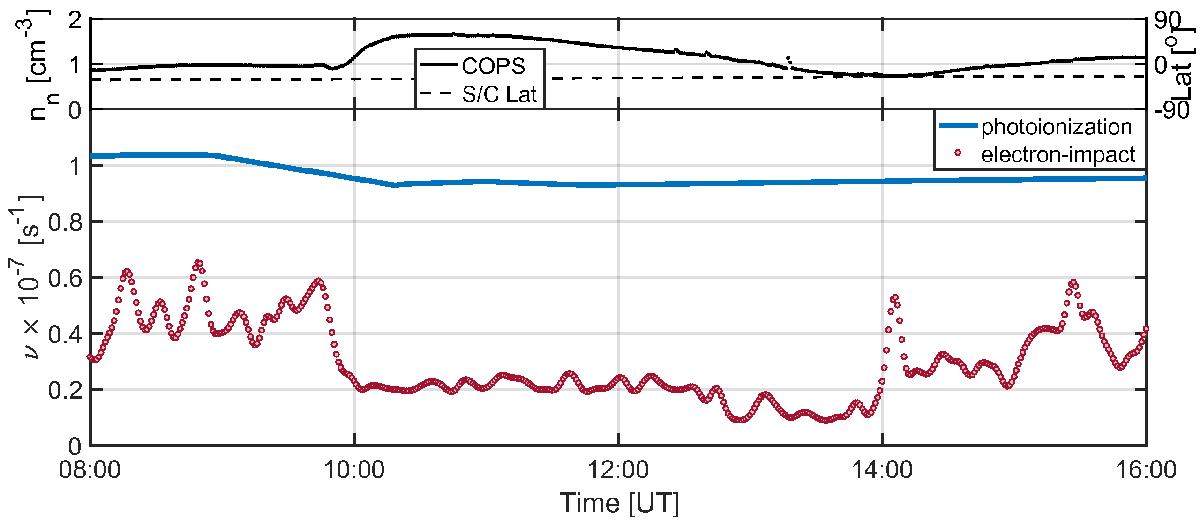
Fig. 9

Top: ROSINA/COPS neutral density nn not corrected for neutral composition (solid line) and sub-spacecraft latitude (dashed line). Bottom: photoionization (blue solid line) and electron-impact ionization (red circles) frequencies, derived from TIMED-SEE solar flux at the Earth and extrapolated to the comet 67P and from RPC-IES electron intensities, respectively (see Galand et al. 2016).
Current usage metrics show cumulative count of Article Views (full-text article views including HTML views, PDF and ePub downloads, according to the available data) and Abstracts Views on Vision4Press platform.
Data correspond to usage on the plateform after 2015. The current usage metrics is available 48-96 hours after online publication and is updated daily on week days.
Initial download of the metrics may take a while.


