Fig. 10
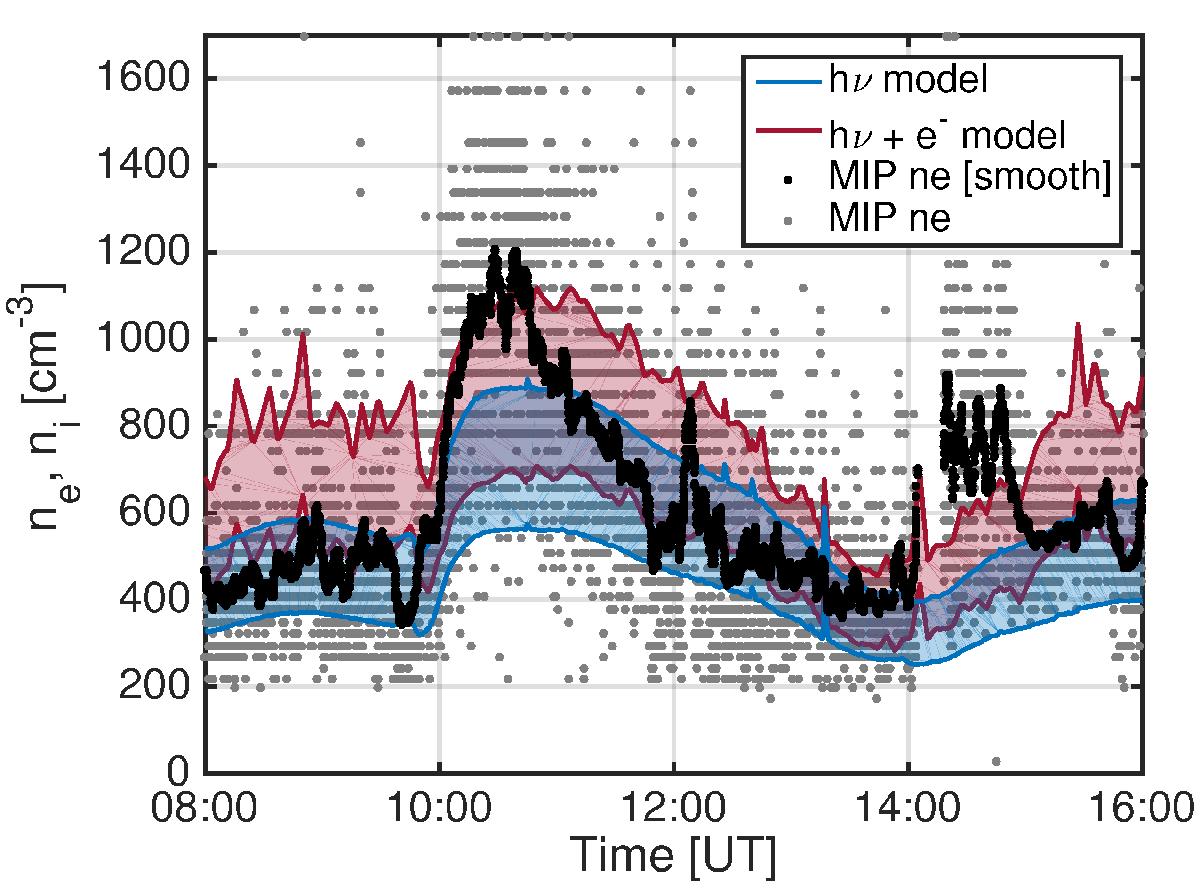
Electron density from RPC-MIP ne plotted in high-resolution (gray dots) and smoothed over 60 points (black dots) on 19 February 2016. The modeled ionospheric densities derived assuming photoionization alone and both photoionization and electron-impact ionization are shown in blue and red, respectively. The colored shaded areas represent the range of ion bulk velocities considered from 900 m s-1 (lower boundary in ni) to 570 m s-1 (upper boundary in ni).
Current usage metrics show cumulative count of Article Views (full-text article views including HTML views, PDF and ePub downloads, according to the available data) and Abstracts Views on Vision4Press platform.
Data correspond to usage on the plateform after 2015. The current usage metrics is available 48-96 hours after online publication and is updated daily on week days.
Initial download of the metrics may take a while.