Fig. 1
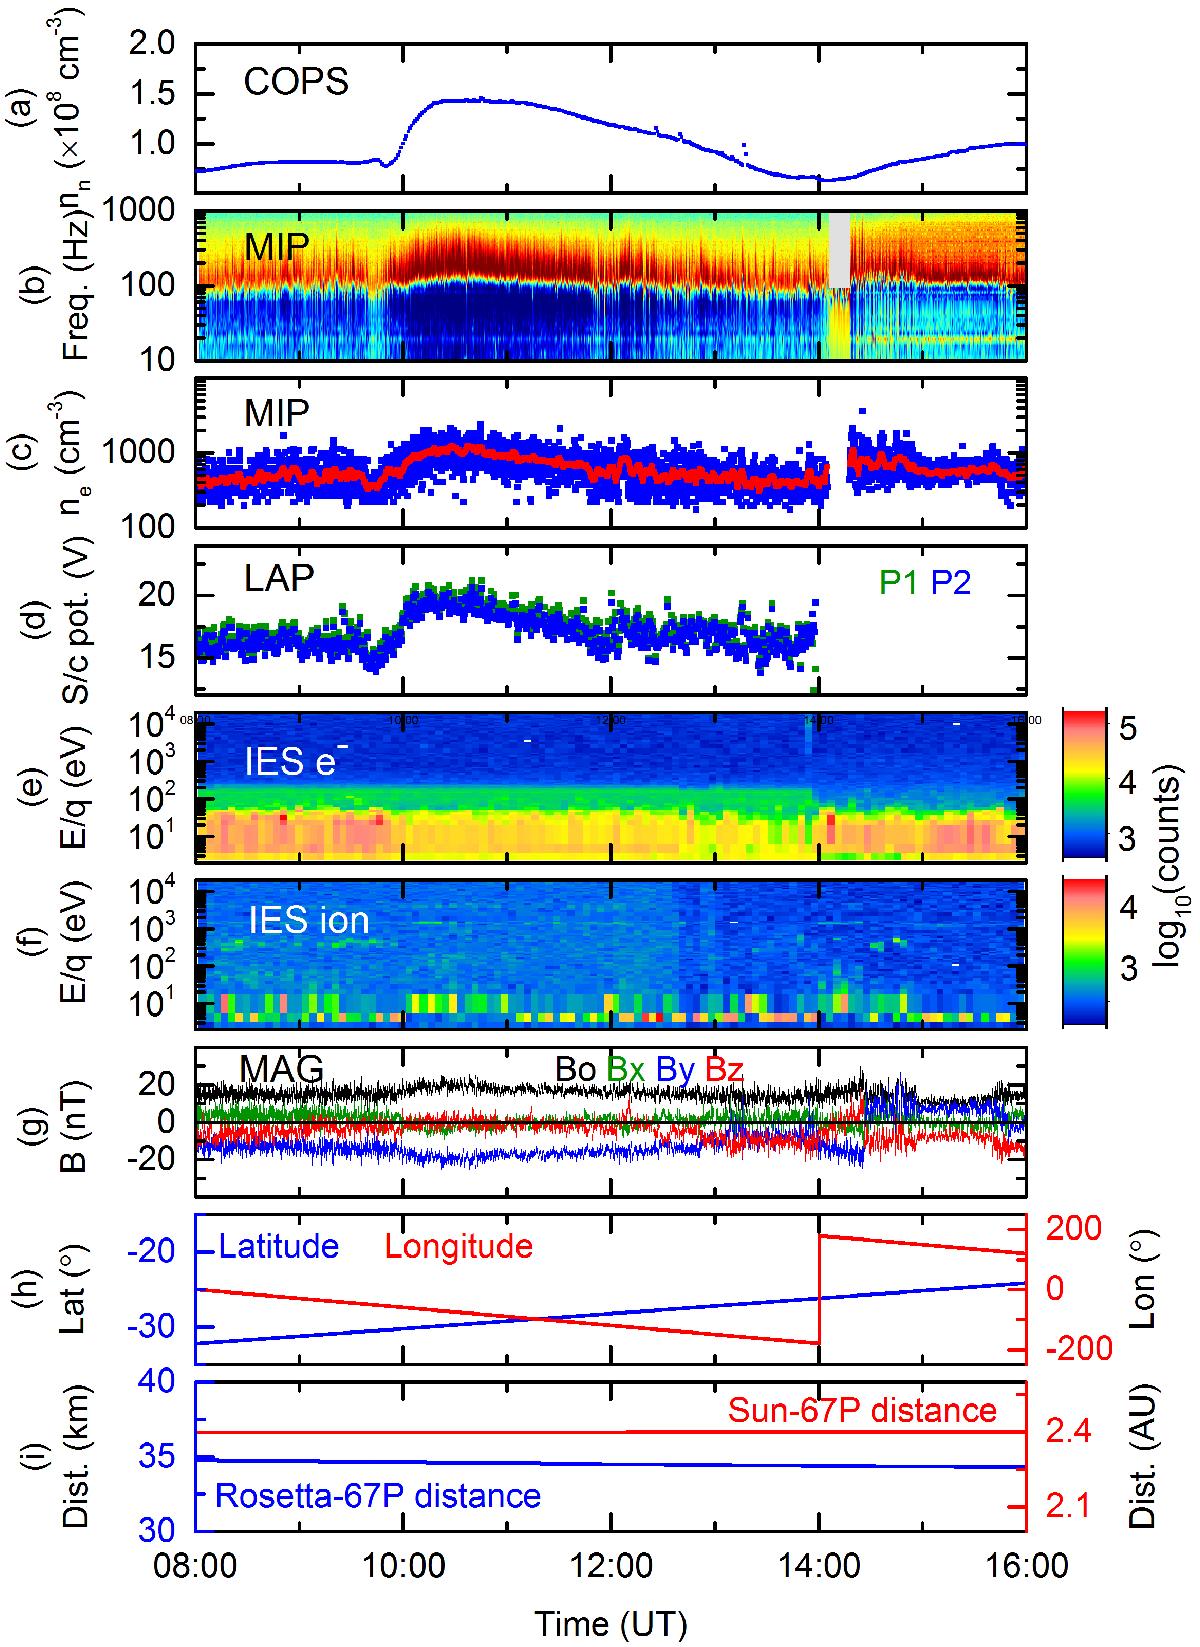
RPC measurements during the outburst on 19 February 2016. From top to bottom, the panels show: a) neutral gas density from ROSINA/COPS; b) RPC-MIP plasma frequency spectrogram; c) electron density estimate from RPC-MIP (blue) along with running average (red); d) negative spacecraft potential from RPC-LAP probes 1 and 2 (P1 and P2); e) electron energy spectrogram from RPC-IES; f) ion energy spectrogram from RPC-IES; g) magnetic field components Bx, By, Bz and magnitude Bo in the cometocentric solar equatorial (CSEQ) coordinates from RPC-MAG; h) cometary latitude (blue, scale on left) and longitude (red, scale on right) of Rosetta; i) distances of the comet from the Sun (red, scale on right) and from Rosetta (blue, scale on left), respectively.
Current usage metrics show cumulative count of Article Views (full-text article views including HTML views, PDF and ePub downloads, according to the available data) and Abstracts Views on Vision4Press platform.
Data correspond to usage on the plateform after 2015. The current usage metrics is available 48-96 hours after online publication and is updated daily on week days.
Initial download of the metrics may take a while.