Fig. 8
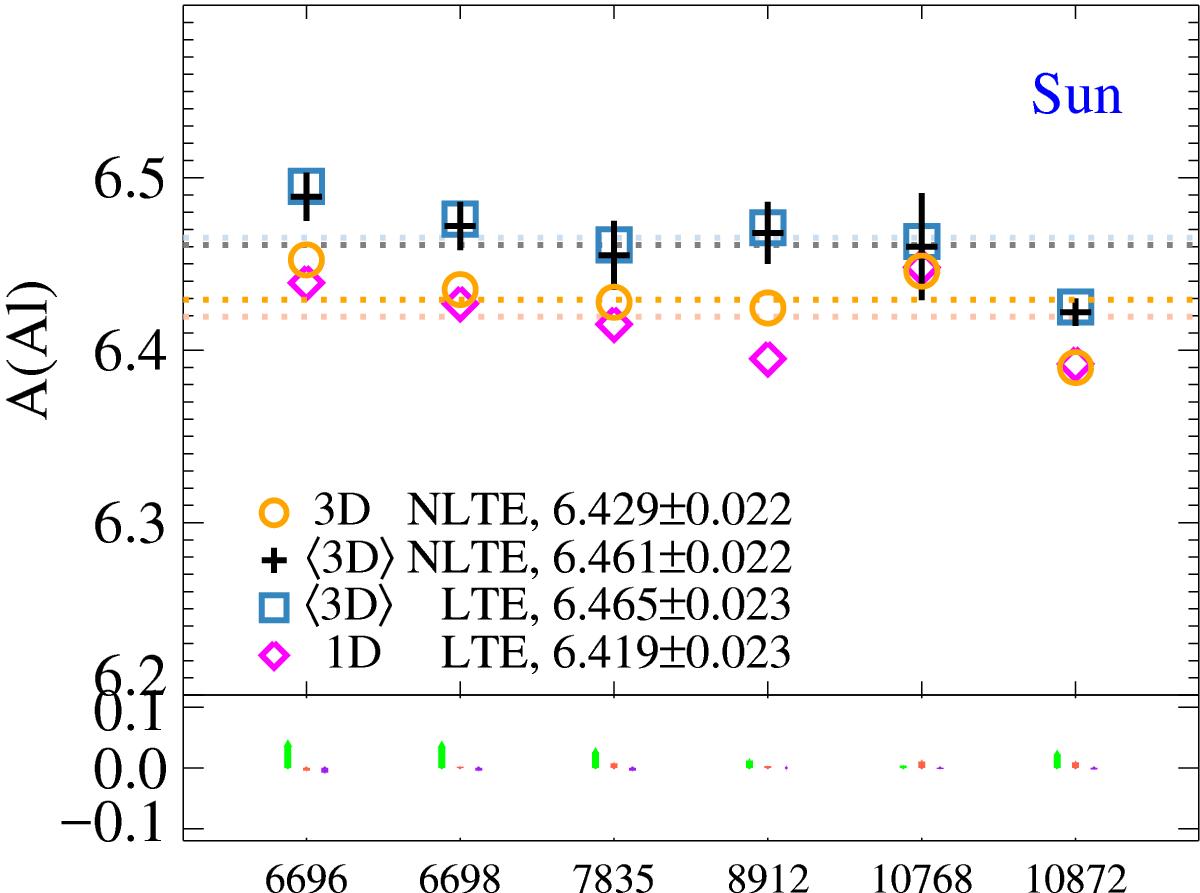
Solar abundance analysis using the Liège disk-center atlas. Abundances are shown for analyses using 3D NLTE (orange circles), as well as ⟨ 3D ⟩ models in both LTE (blue squares) and NLTE (black crosses), and 1D models in LTE (magenta diamonds). The average abundance from each analysis is indicated by the horizontal dashed lines. The height of the crosses indicate the statistical uncertainty in measuring the abundance from each line in the solar spectrum. Below, the sensitivity to changes in stellar parameters is shown for each line, indicating the effect of increasing Teff by 100 K, log g by 0.3 dex, and vmic by 0.3 km s-1. Adopting the weights from Scott et al. (2015) and including estimates of systematic uncertainties, the final 3D NLTE abundance is A(Al) = 6.43 ± 0.03.
Current usage metrics show cumulative count of Article Views (full-text article views including HTML views, PDF and ePub downloads, according to the available data) and Abstracts Views on Vision4Press platform.
Data correspond to usage on the plateform after 2015. The current usage metrics is available 48-96 hours after online publication and is updated daily on week days.
Initial download of the metrics may take a while.