Fig. 5
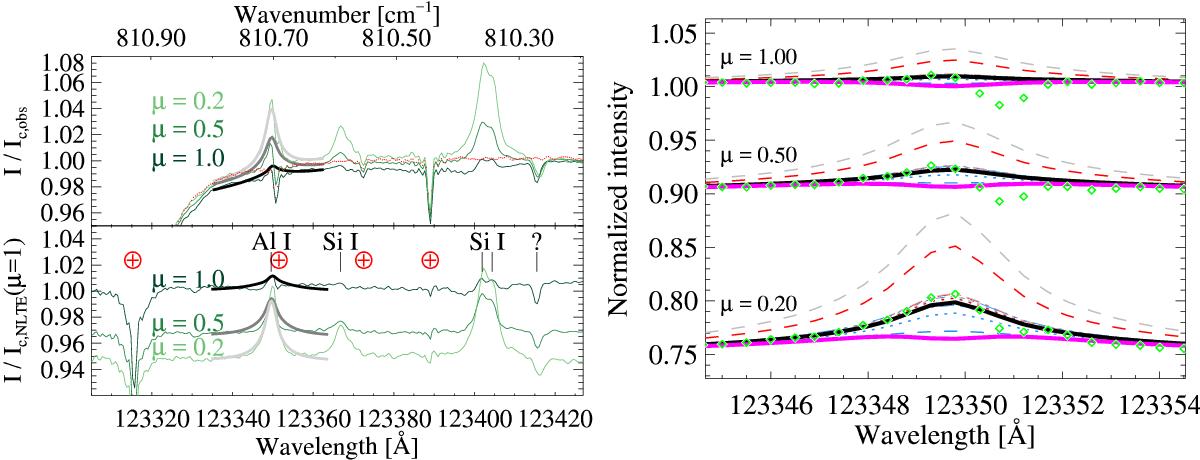
Emission line profiles in the mid-IR, comparing solar intensity spectra to 3D NLTE synthesis (left) and ⟨ 3D ⟩ NLTE and LTE synthesis (right) at different disk positions. Left panel: intensity spectra surrounding the 12.33 μm emission line. Positions toward the limb are shown in fainter colors, and thick lines represent 3D NLTE synthesis. Tellurics are indicated in the lower panel, while stellar lines are labeled. In the top panel, observed spectra have been normalized according to continuum regions outside the plotted region, to highlight center-to-limb variations in the local continuum. The synthetic spectra have been normalized to the observed local continuum, including telluric absorption, and a template telluric spectrum is shown (red dots). In the bottom panel, observations have been divided by the telluric spectrum and then renormalized relative to the predicted continuum intensity at disk center, to show the predicted amount of limb darkening in the continuum. Right panel: zoom of normalized intensity spectra near the Al i emission line, arbitrarily offset for different disk positions, without telluric corrections. Synthetic spectra are shown computed in ⟨ 3D ⟩ LTE (solid magenta), ⟨ 3D ⟩ NLTE (solid black), and in NLTE with different modifications to collisional transition rates, as in Fig. 4.
Current usage metrics show cumulative count of Article Views (full-text article views including HTML views, PDF and ePub downloads, according to the available data) and Abstracts Views on Vision4Press platform.
Data correspond to usage on the plateform after 2015. The current usage metrics is available 48-96 hours after online publication and is updated daily on week days.
Initial download of the metrics may take a while.