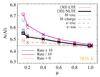
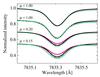
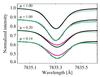
Fig. 4
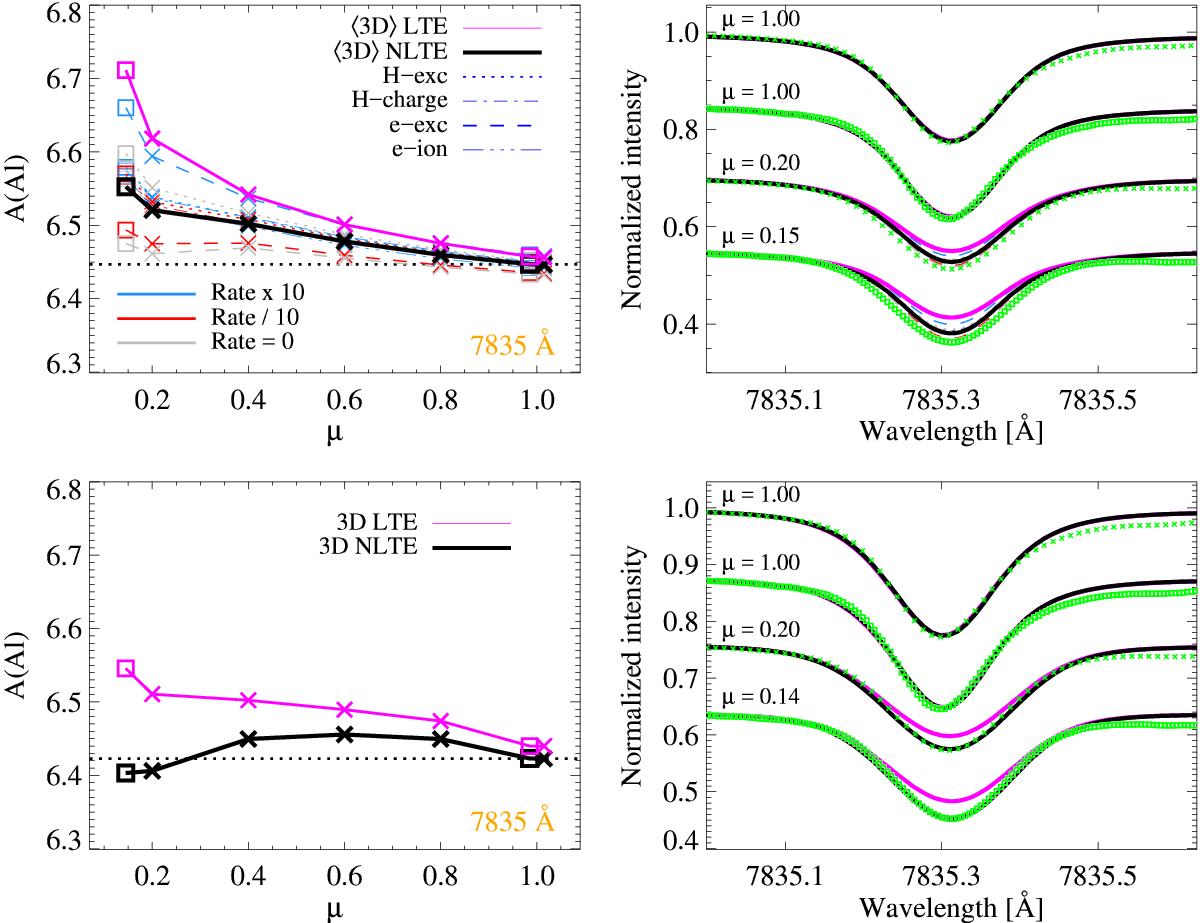
Center-to-limb variations shown for the solar spectrum computed in LTE and NLTE using ⟨ 3D ⟩ (above) or 3D models (below), illustrated as the fitted abundances (left) and the predicted line profiles (right). Observations come from the FTS CLV atlas (squares) and TRIPPEL (crosses). For the ⟨ 3D ⟩ model, rates describing electron collisional excitation (e-exc) and ionization (e-ion), and hydrogen collisional excitation (H-exc) and charge transfer (H-charge) have been increased or decreased by a factor 10 (blue and red), or removed completely (gray). The LTE modeling (solid magenta line) always leads to the highest abundances, and increased and decreased collisional rates give higher or lower abundances than the standard NLTE model, respectively.
Current usage metrics show cumulative count of Article Views (full-text article views including HTML views, PDF and ePub downloads, according to the available data) and Abstracts Views on Vision4Press platform.
Data correspond to usage on the plateform after 2015. The current usage metrics is available 48-96 hours after online publication and is updated daily on week days.
Initial download of the metrics may take a while.