Fig. 13
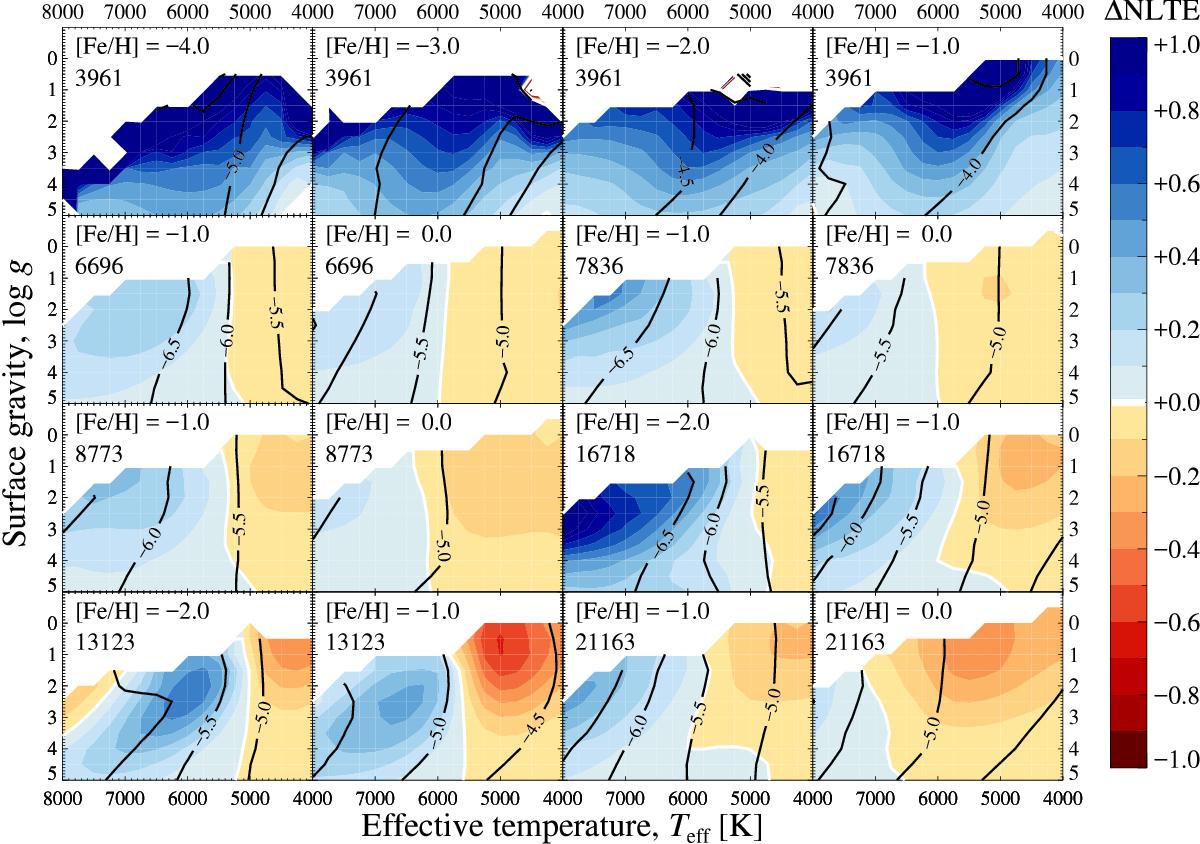
NLTE abundance corrections for representative lines of aluminium, computed at different metallicities with a NLTE reference abundance of [Al/Fe] = 0 for 1D MARCS models. The metallicity and line central wavelength (in units of Å) are indicated in the top left corner of each panel. Overplotted isocontours indicate the reduced line strength, log Wλ/λ. The white line delimits positive from negative abundance corrections, and the color scale is given in steps of 0.1 dex.
Current usage metrics show cumulative count of Article Views (full-text article views including HTML views, PDF and ePub downloads, according to the available data) and Abstracts Views on Vision4Press platform.
Data correspond to usage on the plateform after 2015. The current usage metrics is available 48-96 hours after online publication and is updated daily on week days.
Initial download of the metrics may take a while.