Fig. B.1
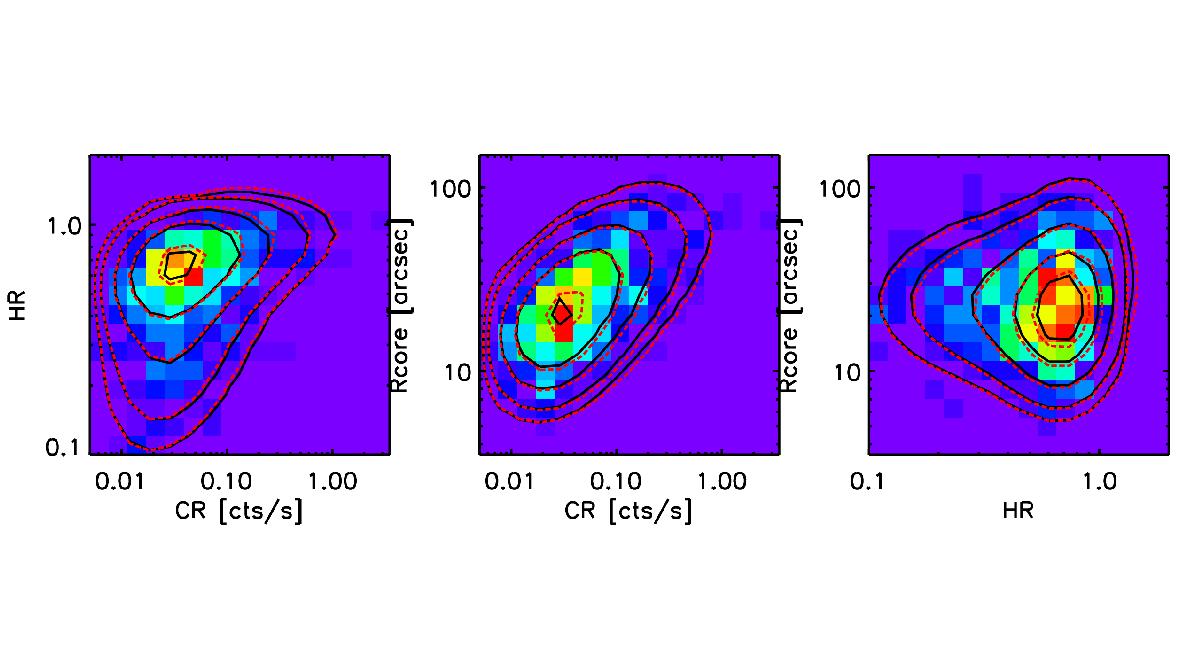
Example of two different models yielding extremely similar integrated HR-CR-rc diagrams. Black contours: the fiducial model, Ωm = 0.23,σ8 = 0.83,Xco = 0.24,w0 = −1. Red contours: Ωm = 0.295,σ8 = 0.768,Xc = 0.203,w0 = −2.251 (Best LH). The background pixel image shows one catalogue realisation for 100 deg2. For the sake of clarity, error measurements are included neither in this figure, nor in the following two (but scatter is implemented in the three scaling relations).
Current usage metrics show cumulative count of Article Views (full-text article views including HTML views, PDF and ePub downloads, according to the available data) and Abstracts Views on Vision4Press platform.
Data correspond to usage on the plateform after 2015. The current usage metrics is available 48-96 hours after online publication and is updated daily on week days.
Initial download of the metrics may take a while.