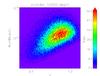
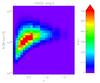
Fig. 2

Top: mass distribution for the selected C1 population and the fiducial parameter set (including scatter in the scaling relations, which impacts the cluster selection). Cluster number densities are calculated for a 10 000 deg2 survey. Pixels represent the catalogue (binning as in Table 3) and contours are computed from the analytical model. Bottom: same as above, rebinned with a linear redshift scale.
Current usage metrics show cumulative count of Article Views (full-text article views including HTML views, PDF and ePub downloads, according to the available data) and Abstracts Views on Vision4Press platform.
Data correspond to usage on the plateform after 2015. The current usage metrics is available 48-96 hours after online publication and is updated daily on week days.
Initial download of the metrics may take a while.