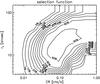
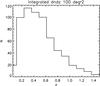
Fig. 1

Top: selection function adopted for the present study. The probability of detecting a cluster as C1 is given by the isocontours as a function of count-rate and core-radius. This map has been derived from extensive XMM image simulations and the two axes represent the true (input) cluster parameters; it is thus only valid for the conditions (exposure time and background) under which the simulations were run. Bottom: resulting cluster redshift distribution for 100 deg2 assuming the set of physical and cosmological parameters given in Tables 1 and 4; the cluster density is of the order of 6/deg2.
Current usage metrics show cumulative count of Article Views (full-text article views including HTML views, PDF and ePub downloads, according to the available data) and Abstracts Views on Vision4Press platform.
Data correspond to usage on the plateform after 2015. The current usage metrics is available 48-96 hours after online publication and is updated daily on week days.
Initial download of the metrics may take a while.