Open Access
Fig. 4
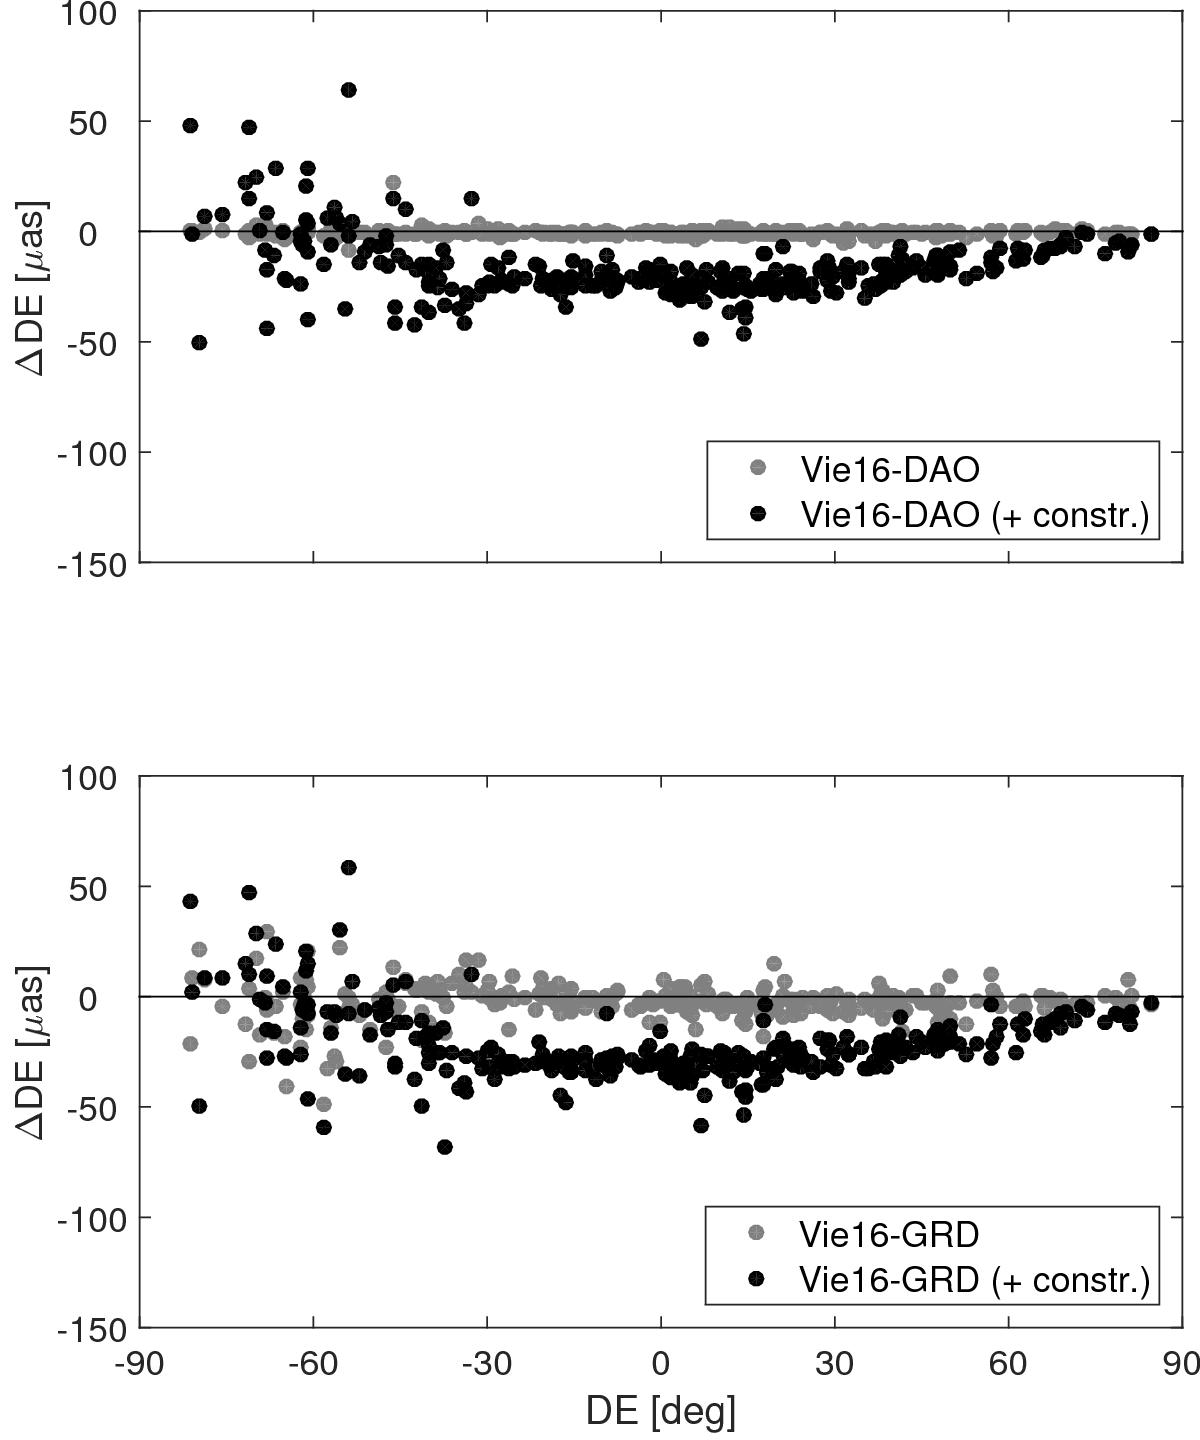
Differences in declination of the ICRF2 defining sources (all 295 sources are depicted). The upper plot depicts the solution with normal parameterisation minus solutions with a priori DAO gradients. The lower plot is similar with the difference that the GRAD model was used.
Current usage metrics show cumulative count of Article Views (full-text article views including HTML views, PDF and ePub downloads, according to the available data) and Abstracts Views on Vision4Press platform.
Data correspond to usage on the plateform after 2015. The current usage metrics is available 48-96 hours after online publication and is updated daily on week days.
Initial download of the metrics may take a while.