Fig. 4
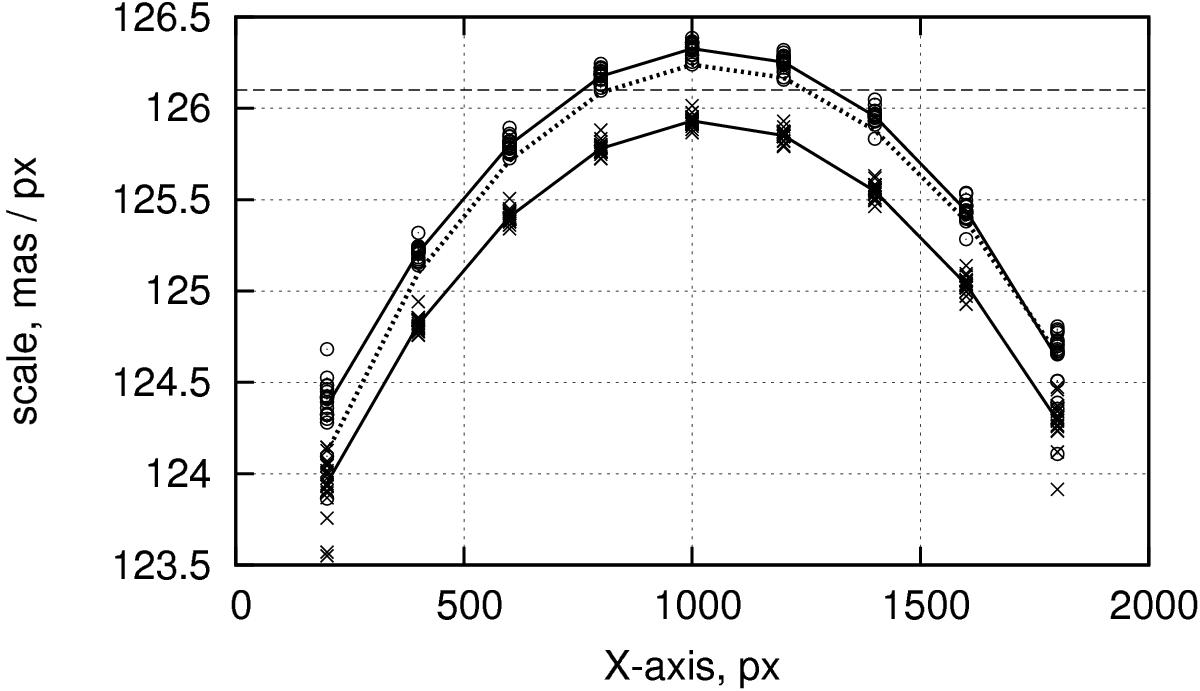
Change of FORS2 pixel scale s in chip1 along the X axis for each sky field at Y = 100 px (open circles) and at Y = 500 px (crosses). The average scales (solid curves), the scale obtained by Lazorenko et al. (2014a, horizontal dashed line),and the scale s computed with use of distortion coefficients in chip 2 at Y = 0 (dotted curve) are shown.
Current usage metrics show cumulative count of Article Views (full-text article views including HTML views, PDF and ePub downloads, according to the available data) and Abstracts Views on Vision4Press platform.
Data correspond to usage on the plateform after 2015. The current usage metrics is available 48-96 hours after online publication and is updated daily on week days.
Initial download of the metrics may take a while.