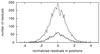
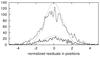
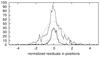
Fig. 3

Distribution of the normalised position residuals Δ between DR1 and RF (solid curves) and between DR1 and FOV (dashed curves) for stars with 1 <σG < 5 mas.Left panel: the normalisation is based on σΔ computed with A = 1.63; middle panel: the same with A = 1; right panel: the same for stars with σG> 7 mas assuming that A = 1. The corresponding Gaussian distributions are shown by dotted lines.
Current usage metrics show cumulative count of Article Views (full-text article views including HTML views, PDF and ePub downloads, according to the available data) and Abstracts Views on Vision4Press platform.
Data correspond to usage on the plateform after 2015. The current usage metrics is available 48-96 hours after online publication and is updated daily on week days.
Initial download of the metrics may take a while.