Fig. 2
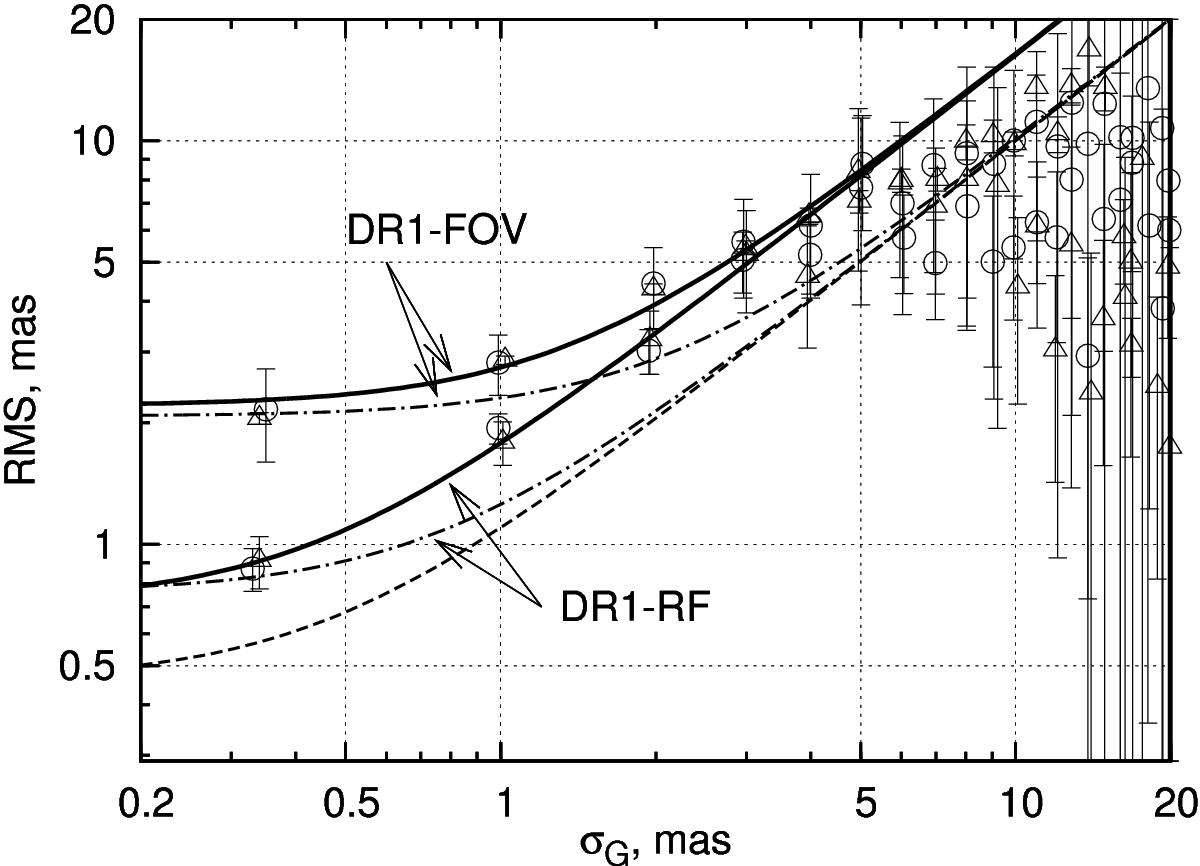
rms of the positional residuals Δ between DR1 and FOV and between DR1 and RF for chip1 (circles) and chip2 (triangles) in every 1 mas bin of σG. Three-sigma error bars are drawn under the assumption of a normal error distribution. These data are compared with the model uncertainty σΔ computed with ν = 0 in Eq. (2) (dashed lines) and with a value of ν that fits the rms at σG < 0.5 mas (dashed-dotted lines). Solid lines show the fit function Eq. (3).
Current usage metrics show cumulative count of Article Views (full-text article views including HTML views, PDF and ePub downloads, according to the available data) and Abstracts Views on Vision4Press platform.
Data correspond to usage on the plateform after 2015. The current usage metrics is available 48-96 hours after online publication and is updated daily on week days.
Initial download of the metrics may take a while.