Fig. 9
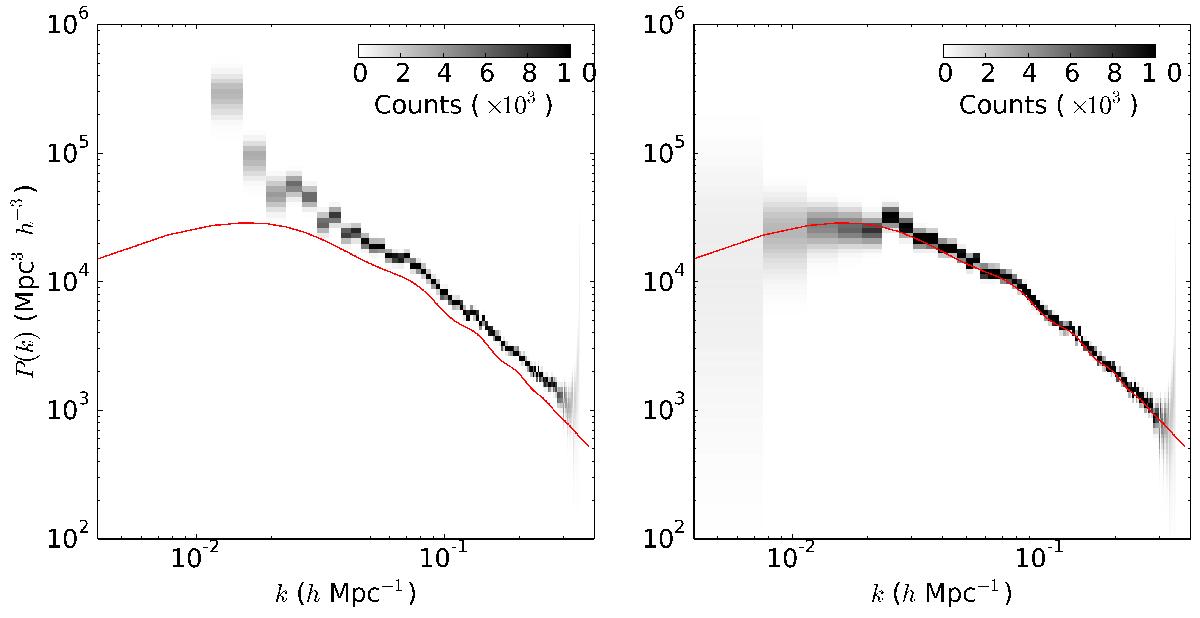
Univariate posterior distributions of power spectrum amplitudes for a test without (left panel) and with (right panel) foreground corrections over the full range of Fourier modes considered in this work. Red lines correspond to the true underlying cosmological power spectrum from which mock data sets were generated. The left panel clearly shows that uncorrected foreground effects yield excessive power for large-scale modes and also introduce an overall biased result. In contrast, the right panel shows results obtained from our test with foreground corrections. Clearly, a detailed treatment of all foreground effects permits us to obtain an unbiased measurement of power spectrum amplitudes over the full range of Fourier modes.
Current usage metrics show cumulative count of Article Views (full-text article views including HTML views, PDF and ePub downloads, according to the available data) and Abstracts Views on Vision4Press platform.
Data correspond to usage on the plateform after 2015. The current usage metrics is available 48-96 hours after online publication and is updated daily on week days.
Initial download of the metrics may take a while.