Fig. 8
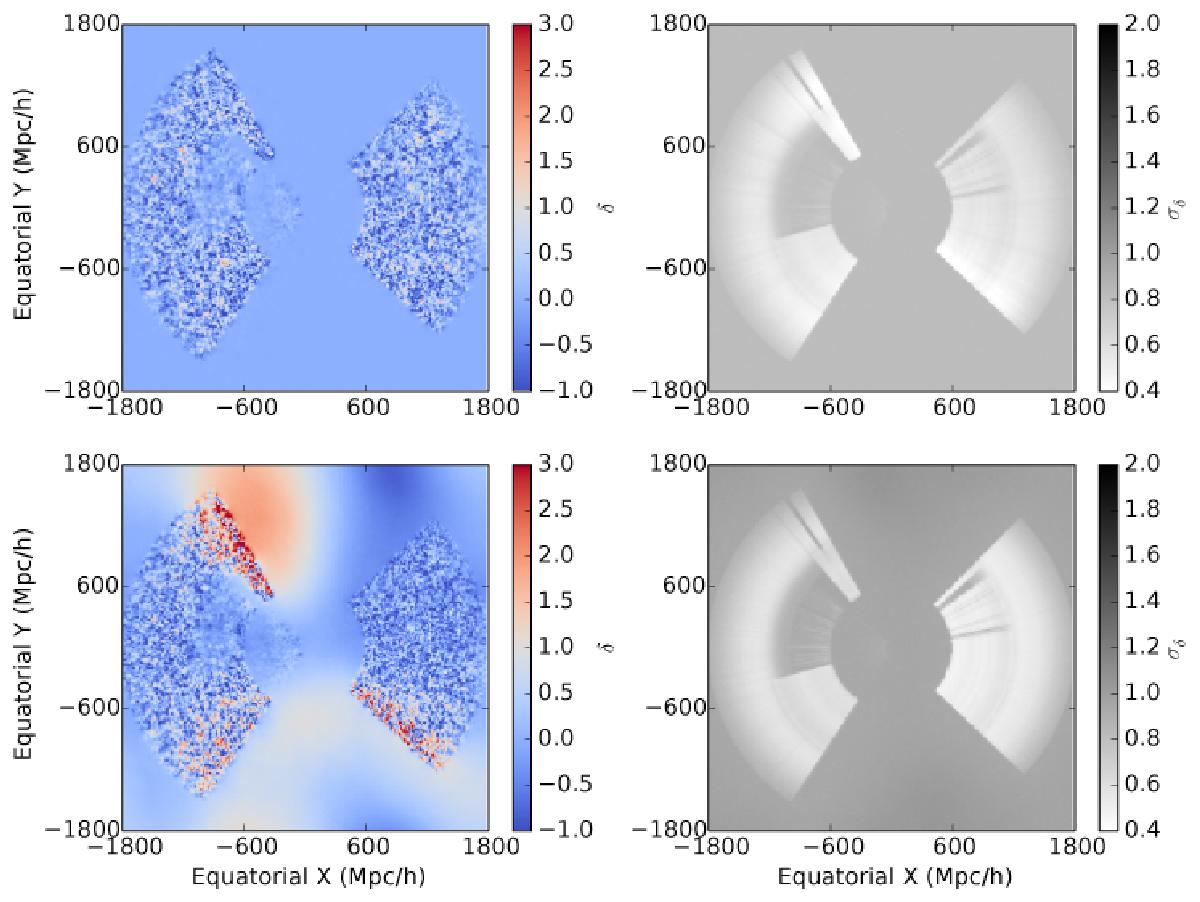
Slices through three-dimensional ensemble mean (left panels) and variance fields (right panels). The top panels show results obtained with foreground correction, while the bottom panels show results without any foreground correction. As for the power spectrum, we find an excessive large-scale power when foreground corrections are not applied. When the foreground is computed self-consistently, the result is a non-contaminated reconstruction. The variance fields are also affected, as is shown by the notably darker bottom on average compared to the top slice, which indicates higher variance.
Current usage metrics show cumulative count of Article Views (full-text article views including HTML views, PDF and ePub downloads, according to the available data) and Abstracts Views on Vision4Press platform.
Data correspond to usage on the plateform after 2015. The current usage metrics is available 48-96 hours after online publication and is updated daily on week days.
Initial download of the metrics may take a while.