Fig. 7
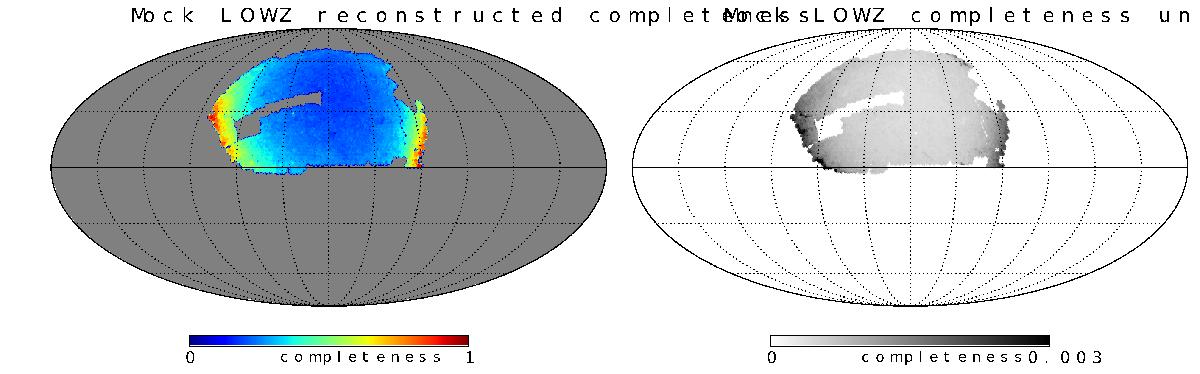
Ensemble mean of the effective survey response operator (left panel) and corresponding standard deviation map (right panel). The ensemble mean is renormalized by the highest pixel value, as the absolute value does not have a meaning independent of the mean density ![]() and the radial selection function. The two above maps should be compared to the north galactic cap of the map in the lower right panel of Fig. 2. The ensemble mean is quite different owing to the introduced star contamination, which could introduce contamination in targets. This manifests itself by an over-completeness on the edge of the map. The right map shows a similar trend, but touching the uncertainty on the selection this time.
and the radial selection function. The two above maps should be compared to the north galactic cap of the map in the lower right panel of Fig. 2. The ensemble mean is quite different owing to the introduced star contamination, which could introduce contamination in targets. This manifests itself by an over-completeness on the edge of the map. The right map shows a similar trend, but touching the uncertainty on the selection this time.
Current usage metrics show cumulative count of Article Views (full-text article views including HTML views, PDF and ePub downloads, according to the available data) and Abstracts Views on Vision4Press platform.
Data correspond to usage on the plateform after 2015. The current usage metrics is available 48-96 hours after online publication and is updated daily on week days.
Initial download of the metrics may take a while.