Fig. 6
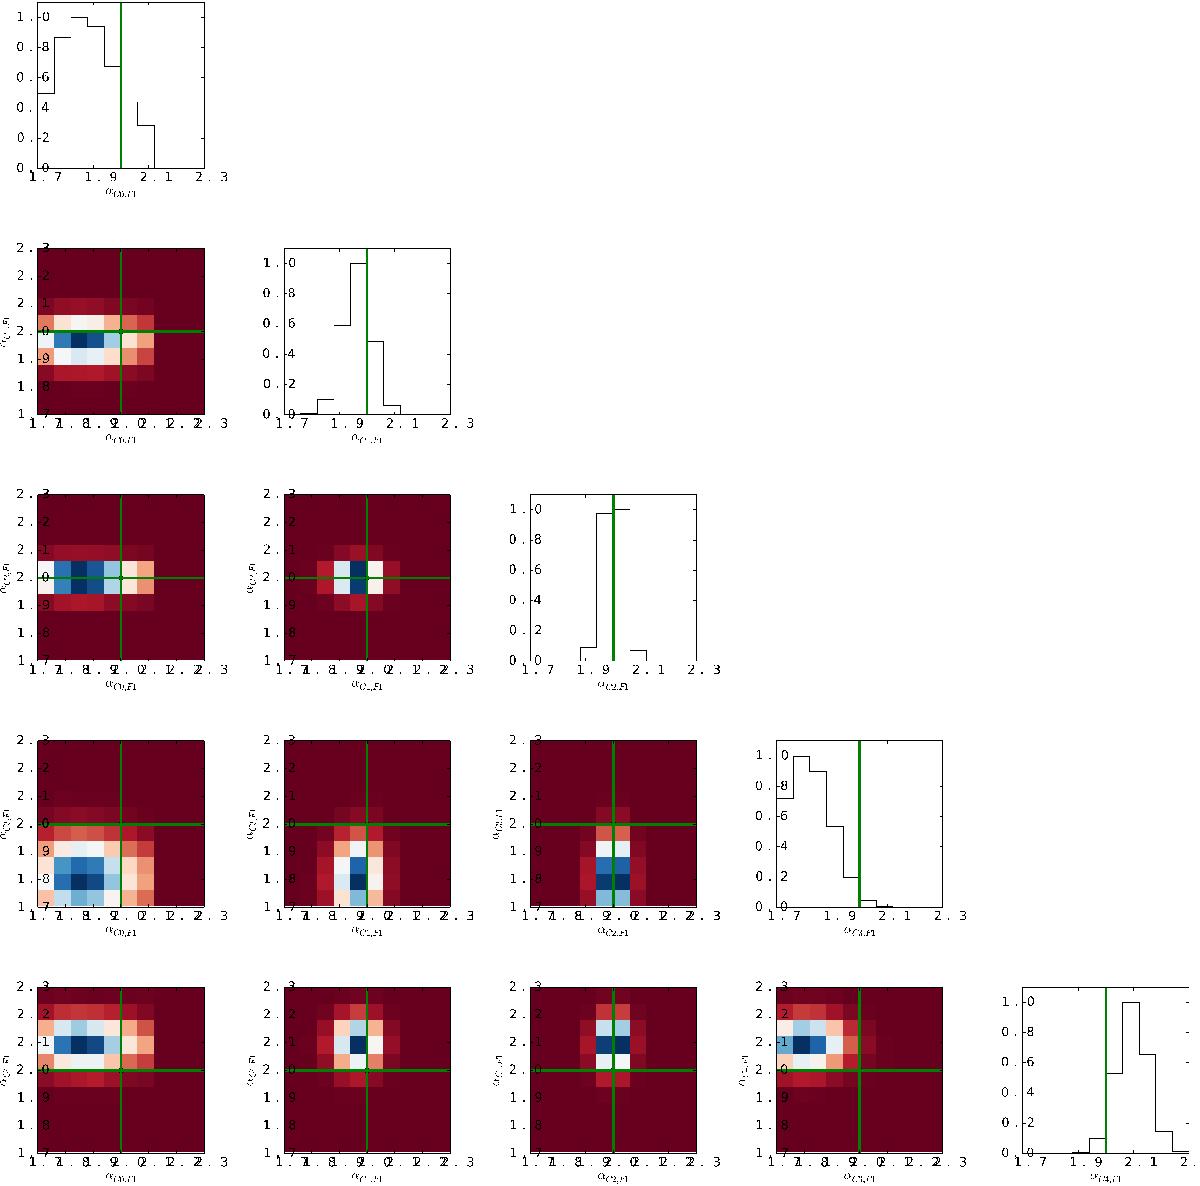
Marginalized two-dimensional probability distributions for foreground contamination coefficients of the five mock catalogues used in this analysis. Green lines indicate the true values of foreground coefficients as used for the generation of the artificial mock galaxy survey. The different panels show various degrees of correlation between inferred coefficients that are correctly accounted for by our Markov chain.
Current usage metrics show cumulative count of Article Views (full-text article views including HTML views, PDF and ePub downloads, according to the available data) and Abstracts Views on Vision4Press platform.
Data correspond to usage on the plateform after 2015. The current usage metrics is available 48-96 hours after online publication and is updated daily on week days.
Initial download of the metrics may take a while.