Fig. 2
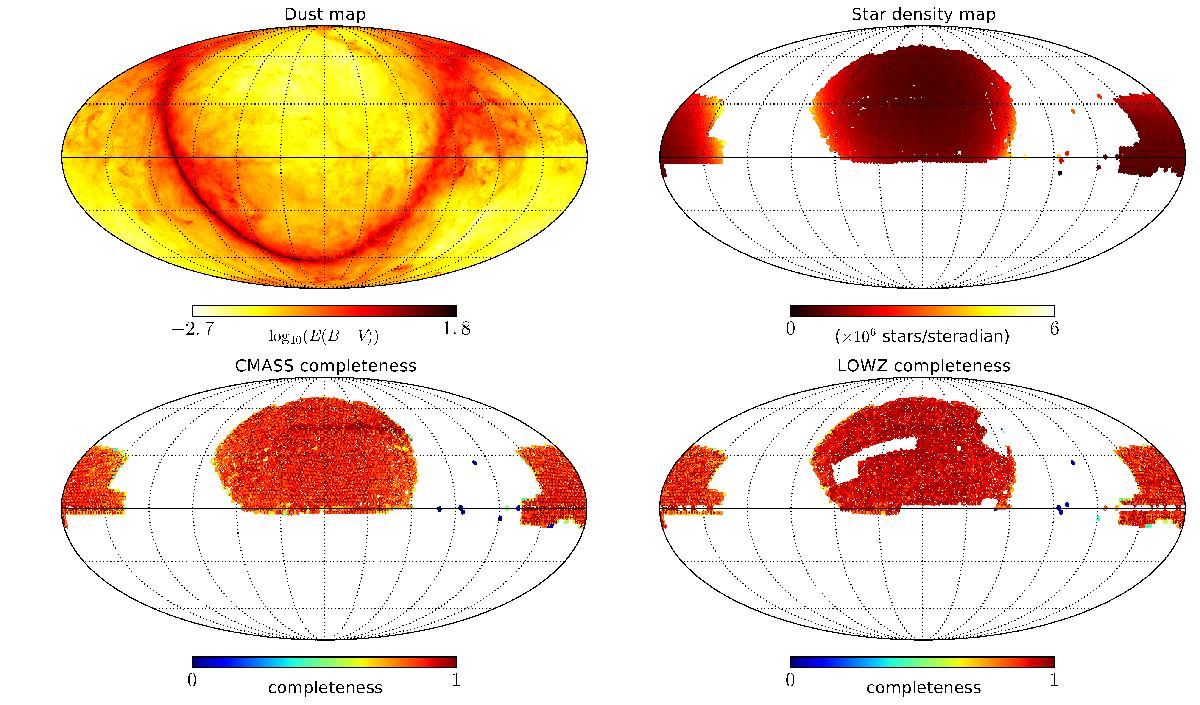
Foreground templates (top row) and the observed sky completenesses (bottom row) used to generate and analyse the mock catalogue in this work. The upper left panel shows the reddening map derived from the data of Schlegel et al. (1998). The upper right panel is a star map count obtained as detailed in Sect. 3. The lower left panel gives the observed completeness for the mock CMASS survey and the lower right panel for the mock LOW-Z survey. These maps have been generated from SDSS-DR12 data (Eisenstein et al. 2011).
Current usage metrics show cumulative count of Article Views (full-text article views including HTML views, PDF and ePub downloads, according to the available data) and Abstracts Views on Vision4Press platform.
Data correspond to usage on the plateform after 2015. The current usage metrics is available 48-96 hours after online publication and is updated daily on week days.
Initial download of the metrics may take a while.