Fig. 11
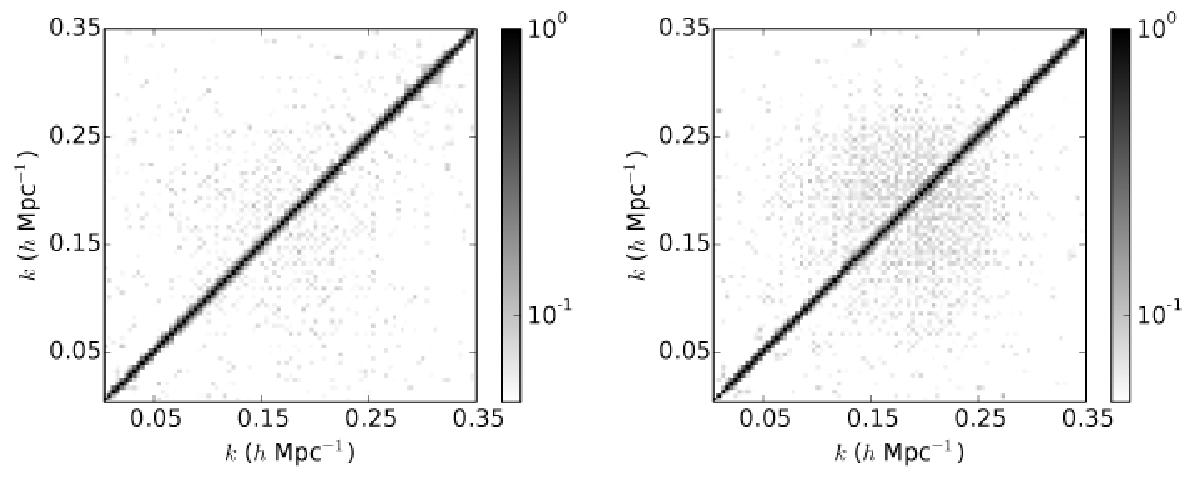
Correlation matrix of power spectrum amplitudes with respect to their mean value in the case of unaccounted foregrounds (left panel) and modelled foregrounds (right panel). The correlation matrix is normalized using the variance of the power spectrum amplitudes. We note that the colour map is truncated at a correlation level of 5 × 10⁻². We estimate that all values below this threshold are too noisy to be cleanly represented and discard them.
Current usage metrics show cumulative count of Article Views (full-text article views including HTML views, PDF and ePub downloads, according to the available data) and Abstracts Views on Vision4Press platform.
Data correspond to usage on the plateform after 2015. The current usage metrics is available 48-96 hours after online publication and is updated daily on week days.
Initial download of the metrics may take a while.