Fig. 5
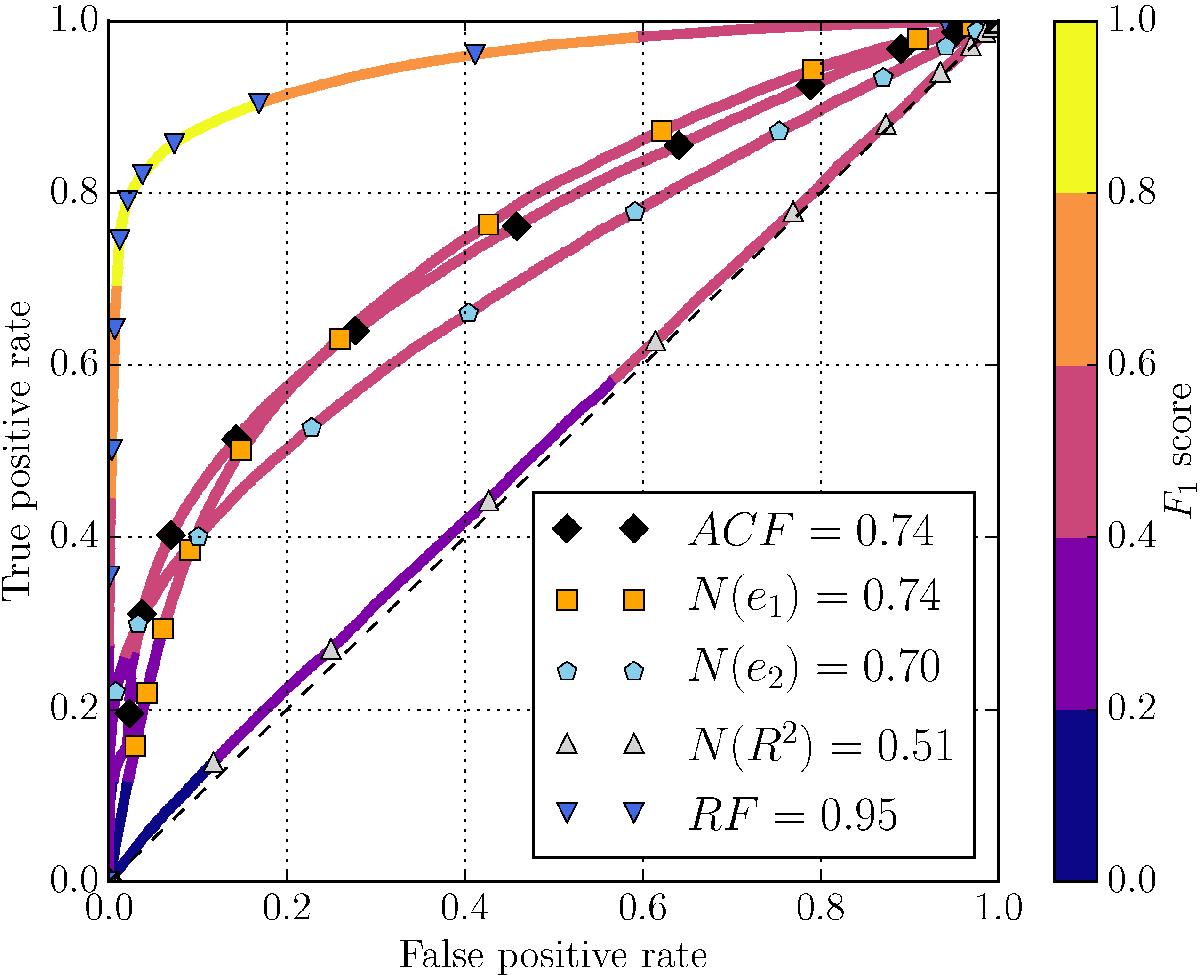
ROC curve for a 5 mas minimum separation and a contrast of up to one magnitude. The curves for the single channel (e1, e2, and R2, denoted N(e1), N(e2), and N(R2)) are shown along with the combined three-channel classifier (denoted ACF) and the RF method. All curves are colour-coded with the F1 score computed at each threshold. The dashed line shows the performance of a random-guess algorithm. The numerical value in the legend is the AUC of the method.
Current usage metrics show cumulative count of Article Views (full-text article views including HTML views, PDF and ePub downloads, according to the available data) and Abstracts Views on Vision4Press platform.
Data correspond to usage on the plateform after 2015. The current usage metrics is available 48-96 hours after online publication and is updated daily on week days.
Initial download of the metrics may take a while.