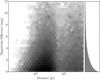
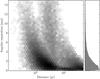
Fig. 3

Numerical model of the binary star density as a function of distance to Earth and contrast (left) and angular separation (right). The grey scales and the histograms are linear and relative to the maximum bin. We select stars in the magnitude range 18 ≤ I(AB) ≤ 24.5. Both plots exhibit bimodal distributions with low-mass main stars located at shorter distances. More massive stars are not located in our direct neighbourhood, as suggested by the distribution of angular separation with distance. Companions of very low mass stars (down to the brown dwarf limit) are rare with the applied selection cuts.
Current usage metrics show cumulative count of Article Views (full-text article views including HTML views, PDF and ePub downloads, according to the available data) and Abstracts Views on Vision4Press platform.
Data correspond to usage on the plateform after 2015. The current usage metrics is available 48-96 hours after online publication and is updated daily on week days.
Initial download of the metrics may take a while.