Free Access
Fig. A.2
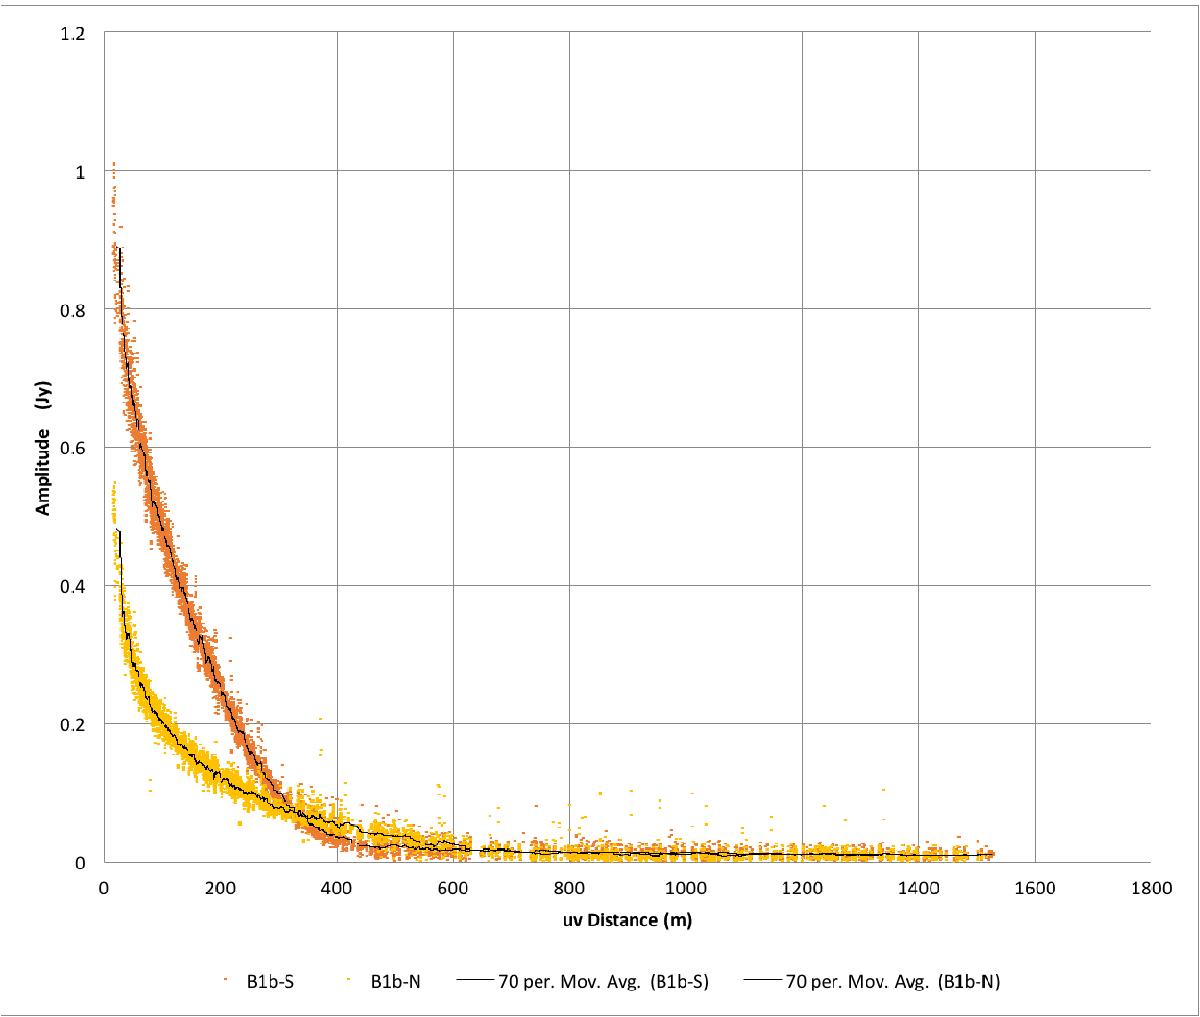
Amplitude of the visibility flux in Jansky versus UV distance in meters for the two data sets. The dots show the full sets of measurements, while the lines trace the moving average values using 70 points. B1b-S is shown in orange, B1b-N in yellow.
Current usage metrics show cumulative count of Article Views (full-text article views including HTML views, PDF and ePub downloads, according to the available data) and Abstracts Views on Vision4Press platform.
Data correspond to usage on the plateform after 2015. The current usage metrics is available 48-96 hours after online publication and is updated daily on week days.
Initial download of the metrics may take a while.